Sorry, but your login has failed. Please recheck your login information and resubmit. If your subscription has expired, renew here.
November 2023
Last month, I had the pleasure of attending the NextGen Supply Chain Awards in Chicago. It was my first time attending the conference, which was in its fifth year, and I came away impressed with both the content and the quality of professionals I met in Chicago. This year’s conference—Strategies for a Digital Future—featured nearly 50 speakers and included CEOs and senior vice presidents, founders and innovators, leading academics and researchers, and top consultants. Over two days of the event at the Chicago Athletic Association, we learned more about artificial intelligence and predictive analytics, robotics and machine learning, fulfillment… Browse this issue archive.Need Help? Contact customer service 1-508-503-1313 More options
It’s not easy running a warehouse operation in this era of heightened expectations driven by the fulfillment speed and accuracy of major e-commerce players and omni-channel retailers. Many operations, even those serving B2B markets, are under pressure to do things faster and more accurately, at a time when finding and retaining labor continues to be cited as a top struggle.
Our annual Warehouse Operations & Trends Survey reflects these dynamics. This year’s findings reveal increasing use of automation as a means of gaining efficiencies, and a slight rise in the use of productivity metrics. The survey also found a slight decrease in average capital expenditure budgets for equipment and technology, but no big fall-off.
The survey, conducted annually by Peerless Research Group (PRG) on behalf of Logistics Management and sister publication Modern Materials Handling, asks about operational factors at DCs, such as size of the DC network, number of employees, average annual inventory turns, use of temporary labor, strategies for coping with peak demand, and other challenges such as finding and retaining labor. The survey also asks about methods for retaining labor, as well as which areas of DC operations are the most congested.
This year, the survey drew 119 qualified responses from professionals in logistics and warehouse operations across multiple verticals. The survey was in the field during September 2023. Respondents were with bigger companies this year, with the average annual revenue size for respondents jumping from $301 million last year to $778 million this year.
Overall, the findings are in step with industry trends, like more e-commerce fulfillment activity and more adoption of automation, software and robotics, according to Don Derewecki, a senior consultant with St. Onge Company, a supply chain engineering and consulting company, and Norm Saenz, Jr., managing director and a partner with St. Onge, who reviewed the survey report to give us added perspective
as they do every year.
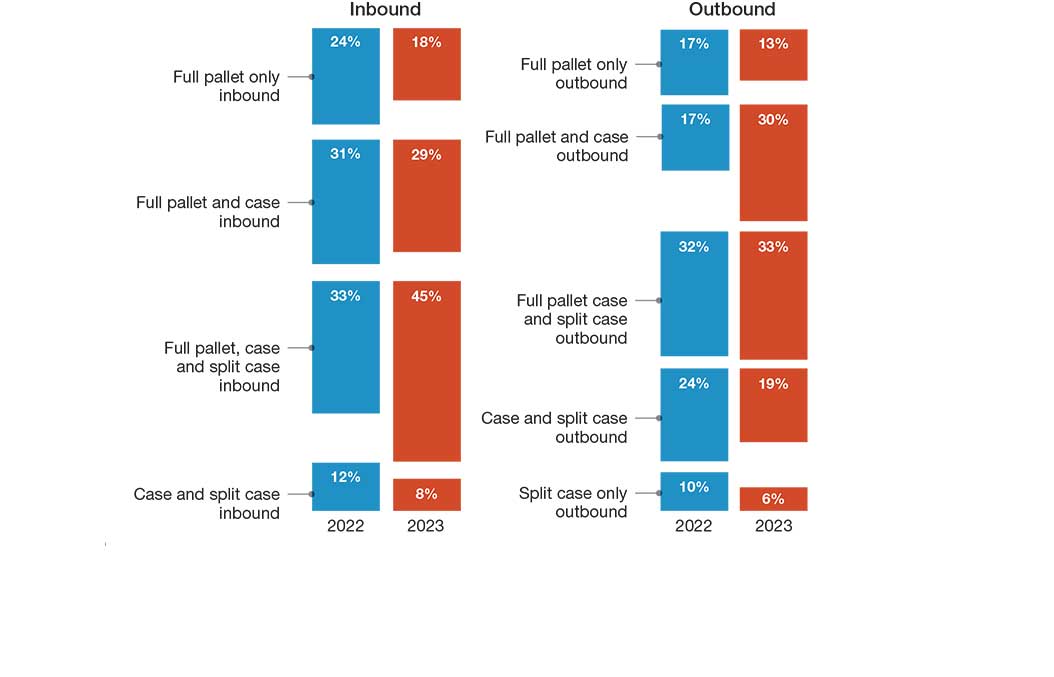
Nature of DC’s inbound/outbound operation
Source: Peerless Research Group (PRG)
“Generally, in the market, we see and hear about increasing use of and interest in technologies including artificial intelligence [AI] and machine learning, in robotics, sensors, and predictive analytics,” says Derewecki. “These technologies are likely to be implemented at an accelerated pace because that’s how operations are going to gain a competitive advantage.”
According to Derewecki, among their clients they’re also seeing high interest in systems and processes that help improve customer service as well as in solutions that improve ergonomics or automate physically demanding tasks. “These ergonomic investments not only show that a company is a good corporate citizen that cares about safety, but it helps with recruitment and retention,” he adds.
Saenz agrees that the survey’s findings on increasing use of automation are consistent with larger market trends. However, he adds that while clients often use technology to drive productivity and address labor scarcity, doing more with less labor is not the only goal.
Many are also looking to improve accuracy and service levels with new systems, as well as with strategies like changes to DC networks, better inventory management to have the right goods in stock, or by use of third-party logistics provider (3PL) resources.
“Operations can’t lose focus on customer satisfaction,” says Saenz. “They not only need to ship orders on time, but they must ensure orders are accurate because their customers in turn need to have products available, or consumers will buy from someone else. It’s all interconnected.”
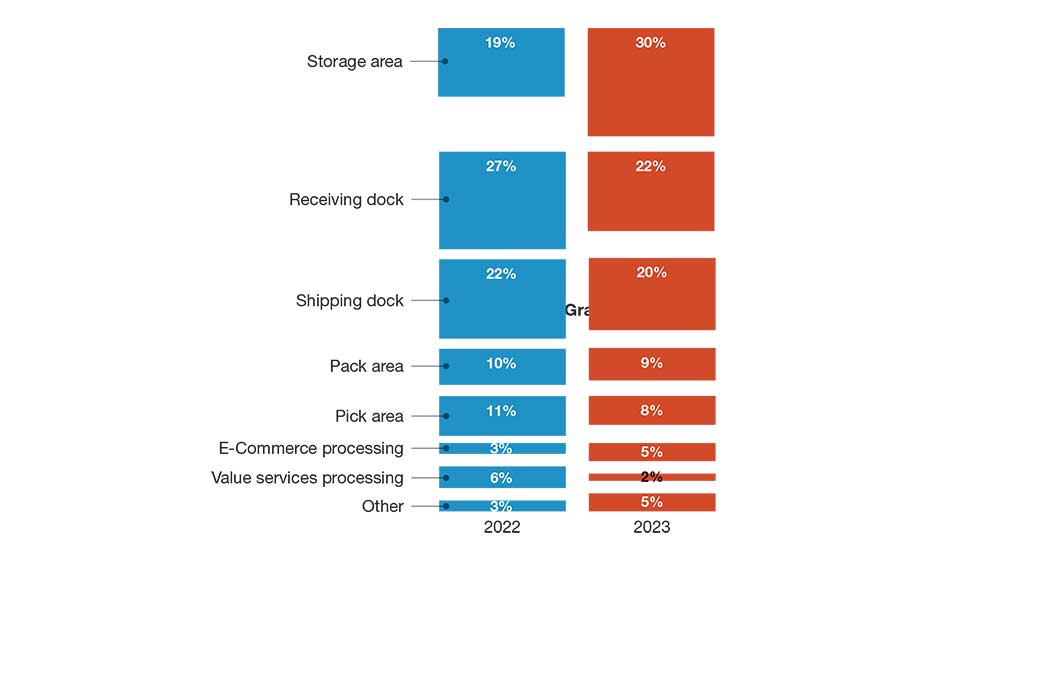
Space utilization:The most congested area in warehouses
Source: Peerless Research Group (PRG)
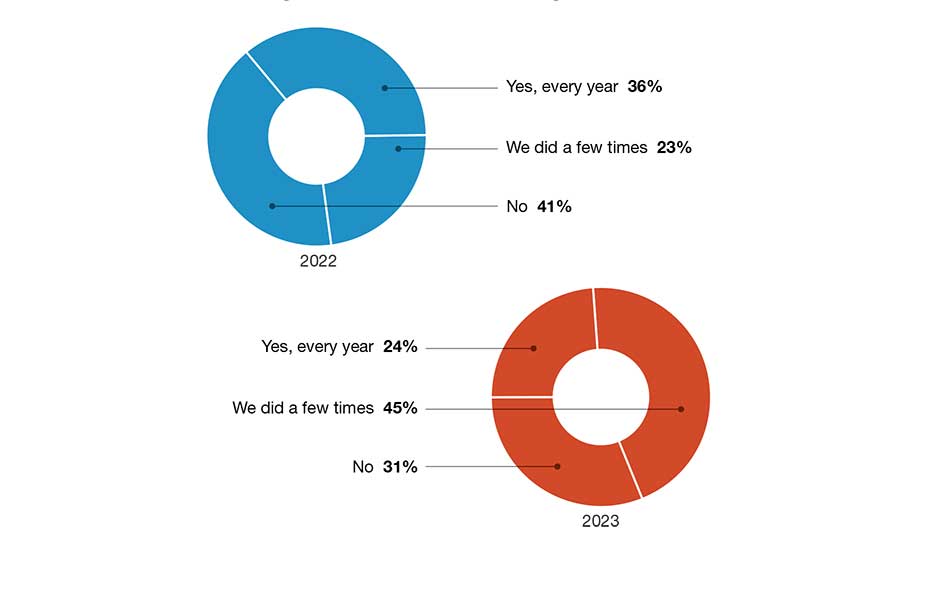
Leasing additional space during peak season
Source: Peerless Research Group (PRG)
Operations characteristics
On the inbound side for 2023, 18% handle full pallet only, compared to 24% last year, while 29% said they deal with full pallet and case, down from 31% last year. Additionally, 45% say they deal with a mix of full pallet, case and split case inbound, while 8% deal with case and split case, for a combined 53% handling case and split case to some degree on the inbound.
On the outbound side, 12% say they deal with full pallet only, down from 17% in 2022, while 30% ship out full pallet and case, up from 17% last year. Meanwhile, 33% said they ship a mix of full pallets, cases, and split case, up just 1% from last year; 19% ship case and split case, compared to 24% last year; and 6% do split case only outbound, down from 10% last year.
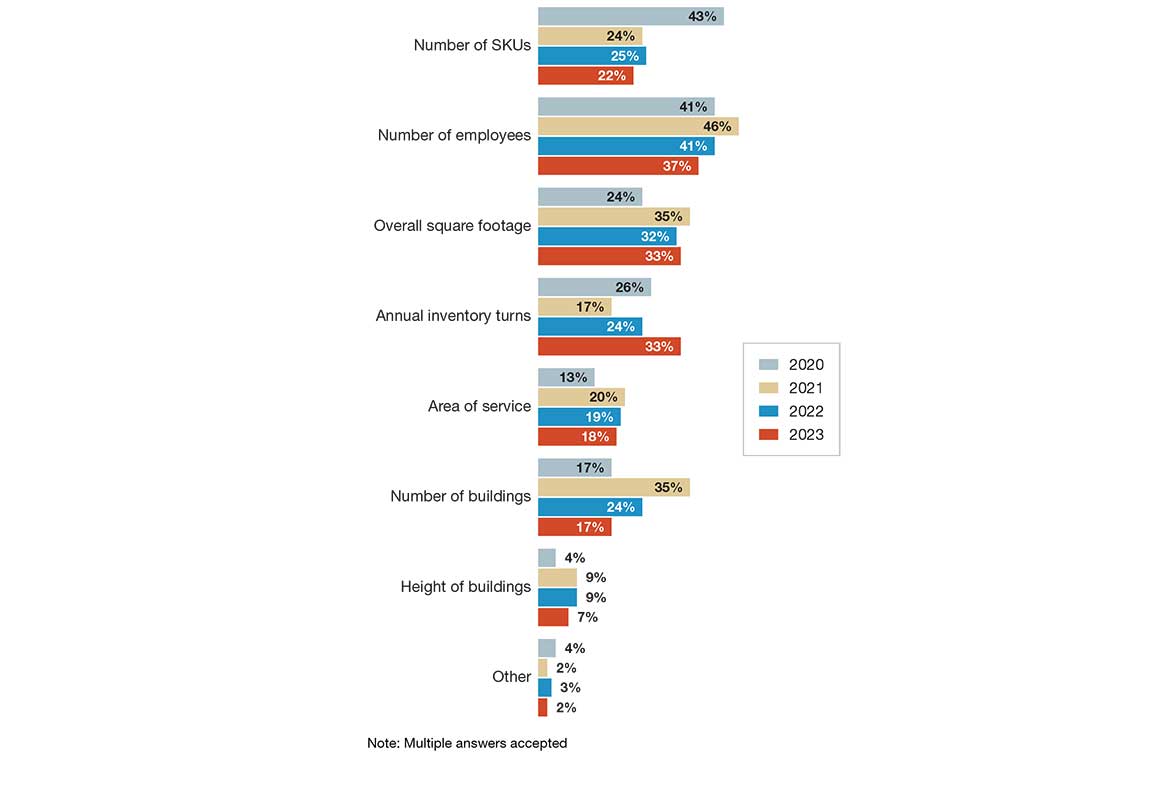
In terms of total square footage in the DC network, the average square footage came to 479,565, up from 413,935 sq. ft. last year, while the median came in at 250,000, up from 245,000 last year. Keep in mind, however, that this year’s respondent pool came from companies with larger annual revenue size (median annual revenue was $175 million, up from $100 million in 2022), which likely influenced some findings.
When we asked about the most common square footage in the network, the overall average was 169,140 sq. ft., down just slightly from 169,550 sq. ft. last year. When there are three or fewer DCs in the network, the average square footage was 227,100 this year, compared to 252,727 in 2022. When the network has four or more buildings, the average this year was 423,315 sq. ft., down from 787,500 sq. ft. last year.
When it comes to number of buildings in the DC network, 32% this year said that they had just one; 17% had two; 8% said three buildings; and 43% reported more than three buildings in the network. Last year, 31% said they had more than three DCs, whereas 29% last year said they had two buildings, 12% higher than this year.
We ask about clear height of buildings in terms of what is common clear height in the network, giving respondents five ranges to select from: under 20 feet; 20 feet to 29 feet; 20 feet to 39 feet; 40 feet to 49 feet; and 50 feet or higher. This year, the average came in at 31.3 feet, up a bit from 30.6 feet last year. Those saying the most common height was 20 feet or less declined from 22% last year, to 14% this year, the biggest year over year shift by range.
There was a leap in the number of employees in the main DC, from an average of 75 last year, to 132 this year. Again, we present ranges for this question. This year, for example, 7% said they had between 500 people and 999 people in the main DC, compared with just 1% of respondents last year, which contributed to the year’s average being higher than in 2022.
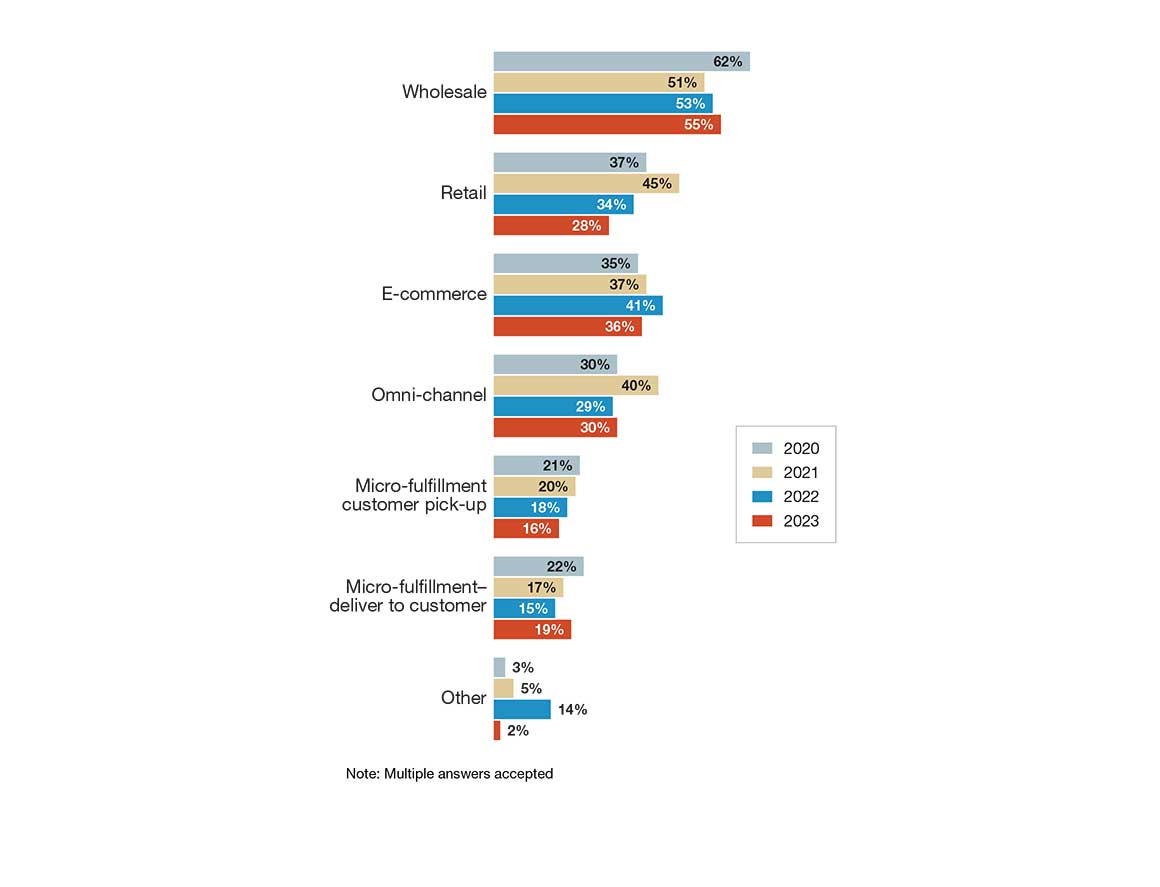
E-commerce and channels
DC operations are shaped by channel strategies and the nature of fulfillment requirements, whether that be filling online orders headed to consumers, business customers, or more frequent, smaller orders for retailers.
While wholesale continues to be the top channel serviced, named by 55% this year, 36% of respondents this year say they are involved in e-commerce fulfillment, while 30% say they have omni-channel responsibilities, 1% higher than last year. Those saying they have an e-commerce channel was down by 5% versus last year’s 41%; but at the same time, there was a slight increase in those saying they’re involved in micro-fulfillment delivery to customers—19% this year, up from 15% in 2022.
Percent of workforce who are temporary during peak volume periods
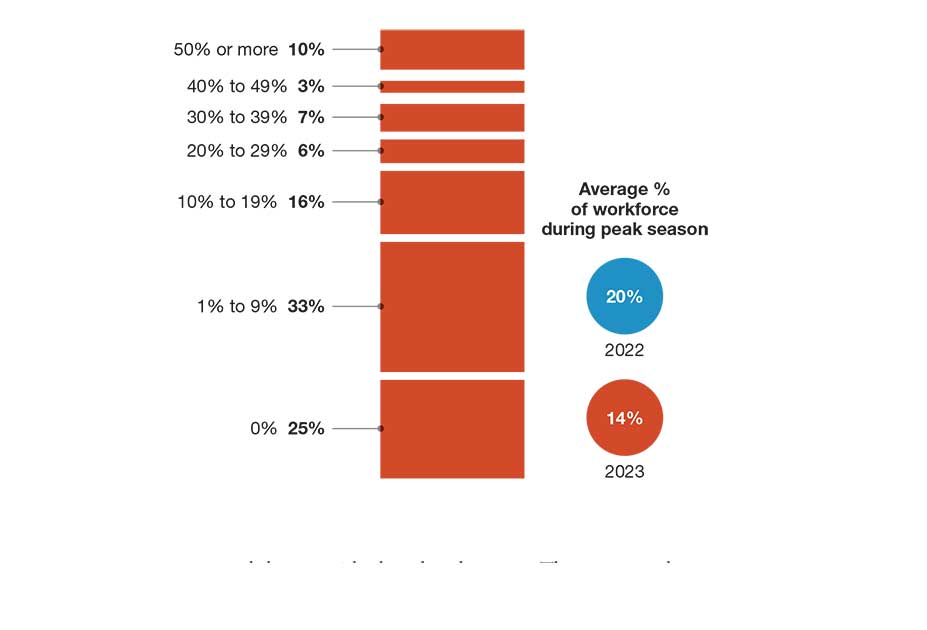
Source: Peerless Research Group (PRG)
When we asked about how channels are being fulfilled, one notable shift was that 14% say that they use a 3PL for e-commerce and their own DCs for other channels, up from 8% last year.
We also ask by what percentage has e-commerce grown in the past 12 months. On this question, there was a significant jump in those saying e-commerce grew between 20% and 29%, garnering a 28% response, up from 15% last year.
Retention improvement labor management practices
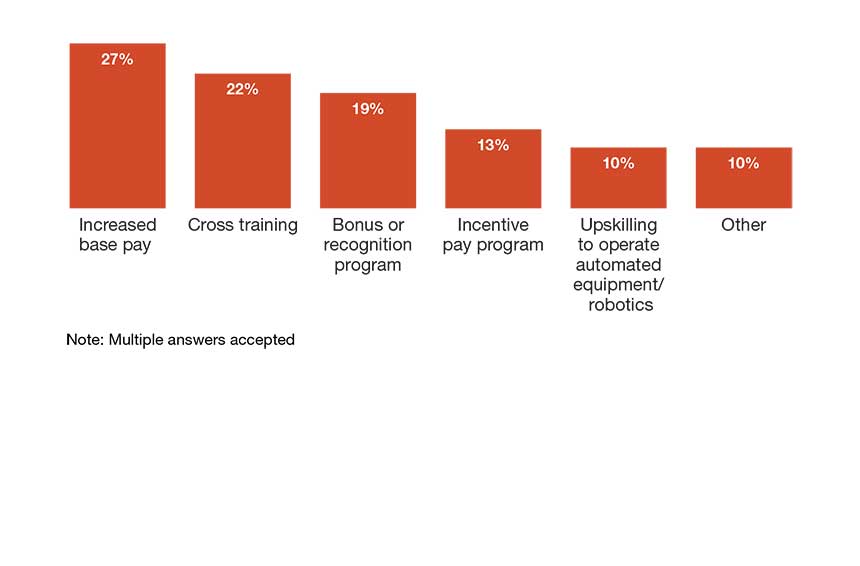
Source: Peerless Research Group (PRG)
Those saying e-commerce grew 60% or more also rose from 2% last year to 9% this year. Of course, e-commerce activity can influence many things, from order picking strategies to design for the DC network or the need to tap 3PLs.
The “most congested” area of the warehouse this year was storage, with a 30% response, up from 19% last year, followed by receiving (22%) and shipping (20%). Last year, 27% named receiving as the most congested area.
E-commerce channel growth in past 12 months
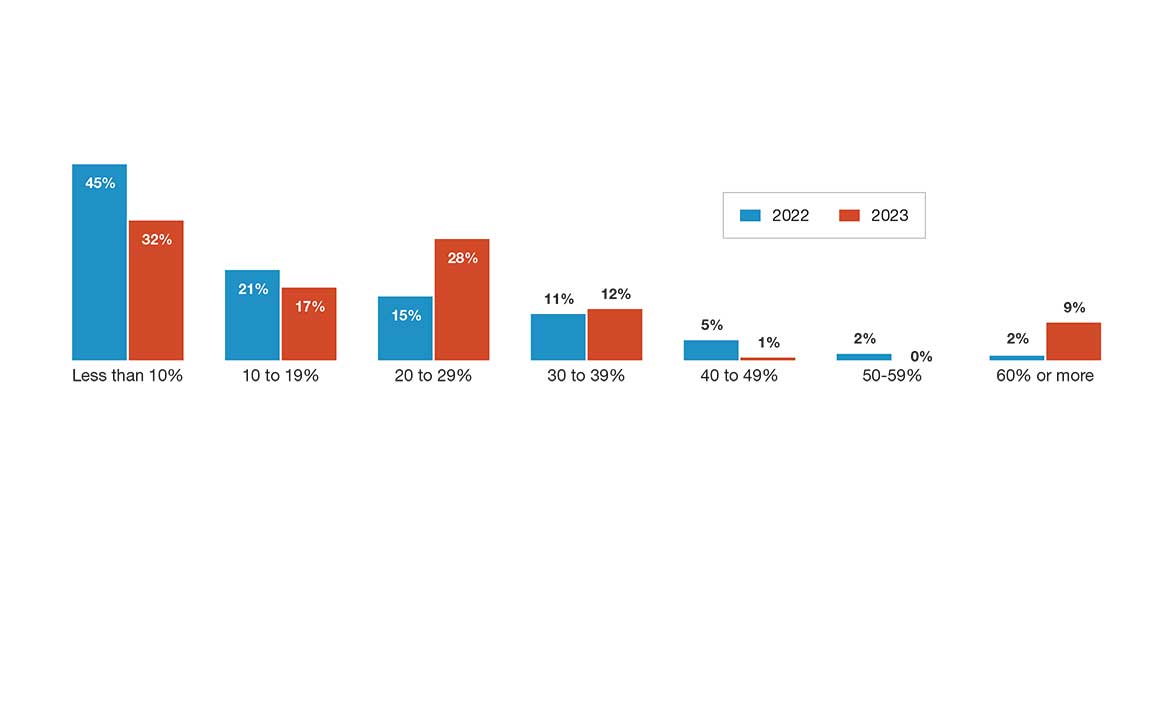
Source: Peerless Research Group (PRG)
Inventory and storage
The average annual inventory turn figure improved by just over a full turn this year, going from 7.1 turns, to 8.2. That’s on par with the 2020 average, and the highest since then. Meanwhile, the average number of SKUs among respondents was 8,494, dipping from last year’s average of 10,371.
Additionally, while asked about DC expansion plans, 33% said they want to improve annual inventory turns, up from 24% last year. In fact, while there was a net 83% of respondents planning some area of expansion, the only area of expansion to climb versus last year was inventory turns. Thirty-seven percent say they plan to add employees, down from 41% last year, while 33% plan to add square footage, up by 1%.
The average peak warehouse space utilization fell from 85.6% last year to 78.5% this year. However, 25% answered that they are between 85% to 94% full on space during peak, 16% say they were between 95% to 100% full at peak, and 5% answered they were 100% full or over.
“When you have that significant a percentage at 85% capacity or over, you really need to be planning ahead on space needs,” notes Derewecki. “Proper planning becomes even more important today because of the cost of warehouse space.”
The survey also asks if, within the past five years, the operation leased additional space during peak times. This year, 24% say yes they have every year, down from 36% last year; 45% say they have a few times, up from 23% among last year’s respondents, while 31% say no, down from 41% last year.
When it comes to the percentage of workforce who are temps during peak, the average this year was 14%, down from 20% in 2022—and also below the 2021 average of 18.3%. Still, 10% indicate that 50% of the workforce were temps during peak, though a quarter indicate that they didn’t use temporary labor at all during peak.
As for methods of finding temporary workers, use of temp agencies led the way at 34%, with on-call workers used by 16%; staffing agencies by 16%; gig worker platforms by 13%; and contract firms by 8%. This is the second year we asked about use of gig worker platforms, and use of these held steady at 13%.
Distribution center expansion plans: Planning to expand over next 12 months
Source: Peerless Research Group (PRG)
Distribution center expansion plans: Areas for expansion
Source: Peerless Research Group (PRG)
We asked about annual employee turnover rate this year. Surprisingly, 36% indicate zero turnover, and 24% say it was under 10%. However, a combined 22% report turnover being 30% or higher.
In terms of retention improvement practices (multiple answers permitted), the leading practice was increased base pay, at 27%, followed by cross-training at 22%; bonus or recognition programs are used by 19%; incentive pay used by 13%; and 10% view placing workers into upskilled positions working with robotics or automation as a retention practice.
Systems and metrics
While PRG conducts a separate survey on equipment spending outlook, this operations study does offer some positive findings on capex budgets and broader use automation. For one thing, projected capex budgets held up.
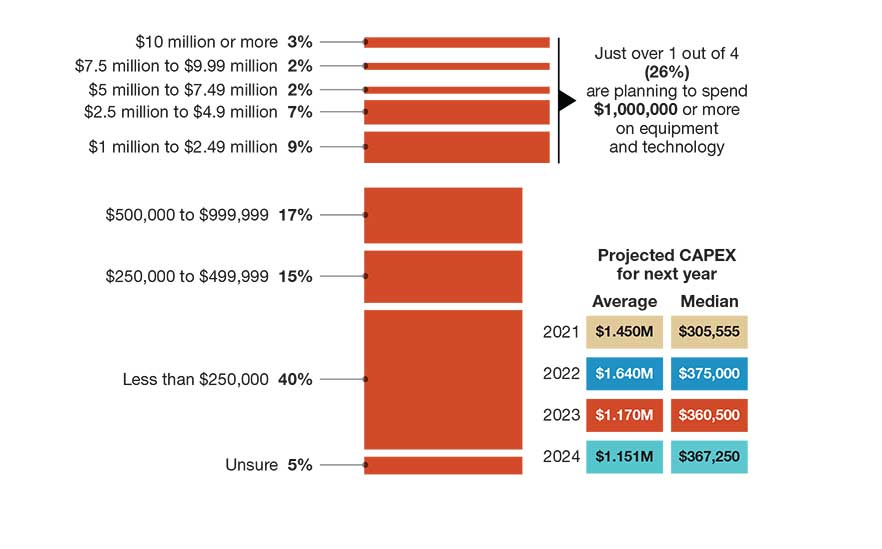
This year, respondents had an average capex projection of $1.15 million for the coming year, down just a hair from last’s year’s average projected capex of $1.17 million. The median actually rose a bit, from $360,500 last year, to $367,250 this year. Looking at budget ranges indicated for 2023, just over one in four (26%) are planning to spend $1 million or more on equipment and technology this year.
Market channels serviced by company
Source: Peerless Research Group (PRG)
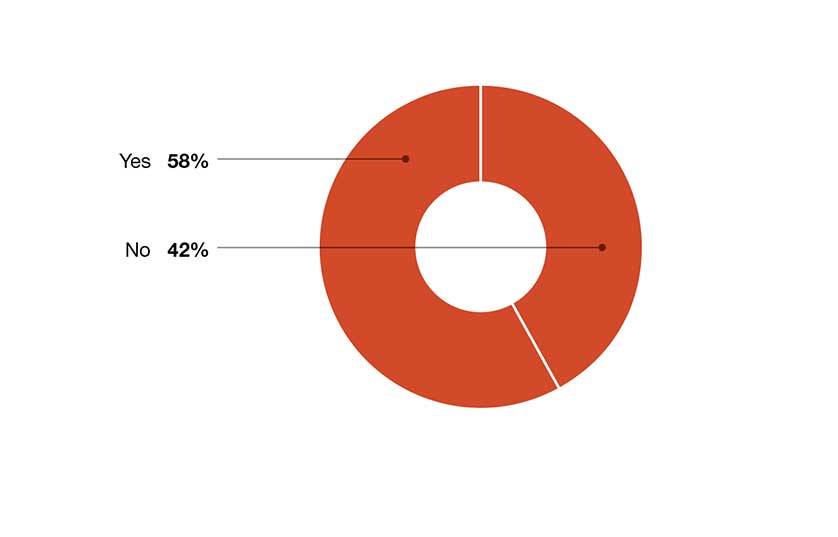
Do you have 100% SKU weight and dims in your item master?
Source: Peerless Research Group (PRG)
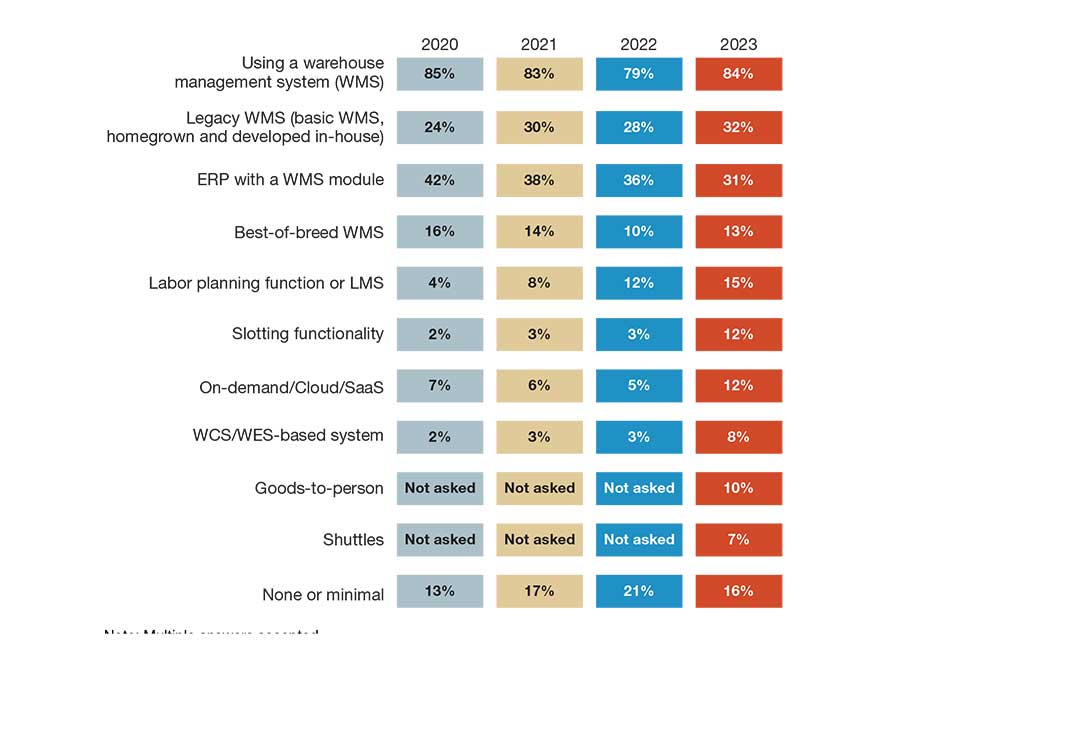
There were numerous signs of growing technology adoption, including the following.
- When asked about use of warehouse management systems (WMS) and related software, net use of a system reached 84%, up from 79% last year. Additionally, use of cloud-based WMS reached 12%, up from 5% last year.
- Use of labor management systems (LMS) functions reached 15%, up from 12%, while use of slotting software hit 12% this year, up from just 3% last year.
- When we asked about materials handling systems in use, both automated and manual, use of autonomous mobile robots (AMRs) and automated guided vehicles (AGVs) shot up to 20% this year, from 7% last year, while use of robotic arms/work cells reached 23%, up from 10%.
- In terms of other systems in use, deployment of conveyors reached 41% this year, up from 31%; while use of vertical lift modules grew from 25% last year to 34% this year. Use of shuttles reached 13%, up from 4%.
- When asked about picking technologies, use of voice-directed solutions jumped from 6% last year to 21% this year. A separate question on order filling techniques also found a 10% increase in the use of batch picking, up from 29% last year to 39% this year.
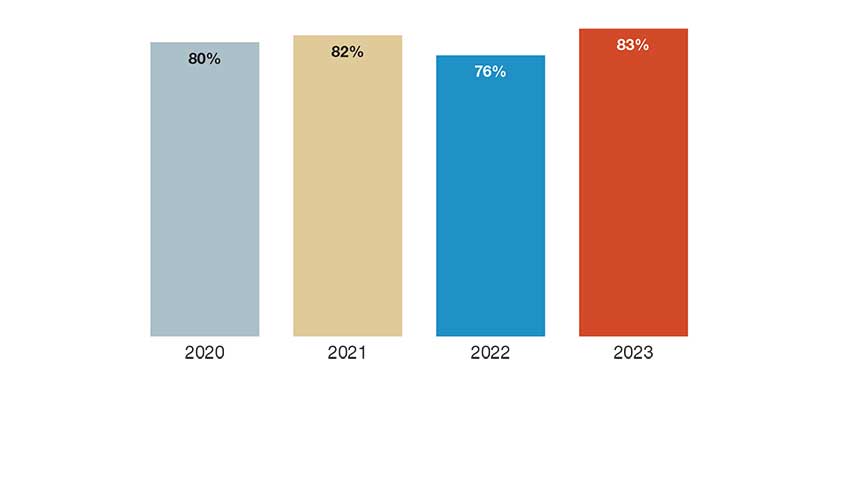
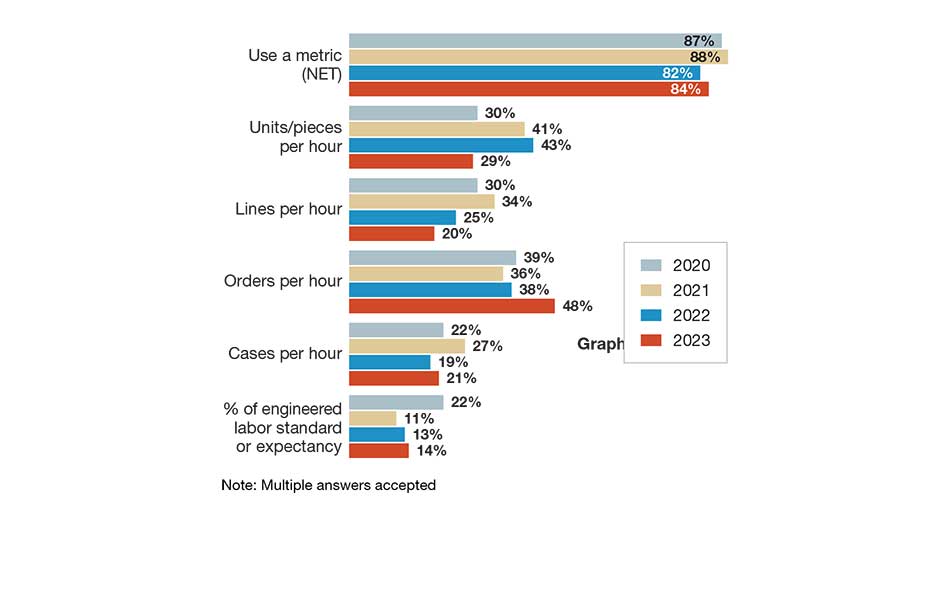
- When we asked about productivity metrics in use, 84% say that they use some type of metric, up from 82% last year, but below the 88% response back in 2021. This year, 48% say they tracked orders per hour, up from 38% last year. There were also slight increases in those tracking cases per hour, and in use of engineered standards.
We also asked about metrics used to manage DC operations, and overall, we found that a net 95% were using a metric of some type, up from 90% last year. In terms of metrics with increased response this year versus last, the only one that rose was on-time shipping, leveraged by 58% this year, up from 52% last year.
Most other metrics were down slightly in reported use, including tracking the perfect order metric. This is a composite metric, which according to the Warehouse Education Research Council, that tracks that orders are complete, on-time, damage free, and correctly documented.
Metrics are powered by data, and in this year’s survey, we found a slight decrease in those who tap their WMS or other systems to automatically collect data, standing at 51% this year, down from 53% last year.
Both Saenz and Derewecki point out that systematic use of metrics is becoming more important to managing DCs, and they advise it’s crucial to not only measure throughput, but to consider composite measures like a perfect order metric, to improve the customer experience.
“The Amazon effect has drifted down to the individual consumer, so everyone expects perfect everything on all orders. The same holds true with B2B fulfillment as well. If you’re shipping a 100-line order to a construction site and 95 of those lines arrive in good condition, but five lines are wrong or broken, you could stop the entire project.” - Derewecki
Top challenges
The findings on major issues making an impact on DC operations were, for the most part, led by perennial concerns like inability to attract and retain sufficient hourly workforce. But overall, the hot button issues trended to moderate to a bit lower than a couple of years ago when the pandemic crisis first hit.
While the challenge of finding and retaining hourly workers still garnered the second highest percentage, with 42% calling it a major issue, it trailed insufficient space, which was named by 44% this year. Perhaps connected to that, 35% say outdated storage, picking and material handling equipment was a major issue, 1% higher than last year.
Other issues with rising response levels this year include inadequate information systems capabilities, cited by 26%, up from 18% last year. Meanwhile, 26% see obsolete DC layouts as a top concern, up 3% from last year.
Warehouse management systems in use
Source: Peerless Research Group (PRG)
Estimated capital expenditures for warehousing equipment and technology in 2023
Source: Peerless Research Group (PRG)
Lack of SKU weight and dimensions (aka “dim”) also rose as a concern, but only up by 3%. A more encouraging finding, in terms of signs that global supply chain snarls have moderated, was that this year, only 31% call “supply chain disruptions, particularly with China,” a major issue, which was down sharply from 47% last year, when we first listed it as an issue to rate.
When we asked about actions taken to lower DC operating costs, 96% had taken some form of action, 4% higher than last year. Those adding automation to processes grew from 19% last year to 21% this year, but non-technology actions like improving warehouse processes—named by 71%, up from 66%—and changing layouts were also on the rise.
We ask every year about whether respondents believe they have accurate weights and dims in their item masters, and this year, 58% say yes, down from the 66% who answered yes on this question last year.
Each year the survey also asks if your supply chain operation has experienced a catastrophic event of some type (including extreme weather like hurricanes, or events like strikes or supplier failures) in the past two years. This year, 23% of respondents say they had experienced a catastrophic event in the past two years, while 77% say no. Last year, that breakdown was 32% who said yes, and 68% who said no.
Productivity metrics in use
Source: Peerless Research Group (PRG)
Overall, operations are looking at technology to raise their level of both productivity and service, says Saenz, but higher interest rates have increased the cost of capital, which tends to make operations more reluctant to put in new systems versus when rates were near historic lows.
In some cases, adds Saenz, it makes sense to apply budget to maintaining or upgrading older systems. “You can’t just focus on the shiny new technologies,” he adds. “You need to keep your eye on the health of your existing systems and buildings, and ensure that they’re going to remain productive for the next 10 years to 20 years.”
SC
MR
Sorry, but your login has failed. Please recheck your login information and resubmit. If your subscription has expired, renew here.
November 2023
Last month, I had the pleasure of attending the NextGen Supply Chain Awards in Chicago. It was my first time attending the conference, which was in its fifth year, and I came away impressed with both the content and… Browse this issue archive. Access your online digital edition. Download a PDF file of the November 2023 issue.It’s not easy running a warehouse operation in this era of heightened expectations driven by the fulfillment speed and accuracy of major e-commerce players and omni-channel retailers. Many operations, even those serving B2B markets, are under pressure to do things faster and more accurately, at a time when finding and retaining labor continues to be cited as a top struggle.
Our annual Warehouse Operations & Trends Survey reflects these dynamics. This year’s findings reveal increasing use of automation as a means of gaining efficiencies, and a slight rise in the use of productivity metrics. The survey also found a slight decrease in average capital expenditure budgets for equipment and technology, but no big fall-off.
The survey, conducted annually by Peerless Research Group (PRG) on behalf of Logistics Management and sister publication Modern Materials Handling, asks about operational factors at DCs, such as size of the DC network, number of employees, average annual inventory turns, use of temporary labor, strategies for coping with peak demand, and other challenges such as finding and retaining labor. The survey also asks about methods for retaining labor, as well as which areas of DC operations are the most congested.
This year, the survey drew 119 qualified responses from professionals in logistics and warehouse operations across multiple verticals. The survey was in the field during September 2023. Respondents were with bigger companies this year, with the average annual revenue size for respondents jumping from $301 million last year to $778 million this year.
Overall, the findings are in step with industry trends, like more e-commerce fulfillment activity and more adoption of automation, software and robotics, according to Don Derewecki, a senior consultant with St. Onge Company, a supply chain engineering and consulting company, and Norm Saenz, Jr., managing director and a partner with St. Onge, who reviewed the survey report to give us added perspective
as they do every year.
Nature of DC’s inbound/outbound operation
Source: Peerless Research Group (PRG)
“Generally, in the market, we see and hear about increasing use of and interest in technologies including artificial intelligence [AI] and machine learning, in robotics, sensors, and predictive analytics,” says Derewecki. “These technologies are likely to be implemented at an accelerated pace because that’s how operations are going to gain a competitive advantage.”
According to Derewecki, among their clients they’re also seeing high interest in systems and processes that help improve customer service as well as in solutions that improve ergonomics or automate physically demanding tasks. “These ergonomic investments not only show that a company is a good corporate citizen that cares about safety, but it helps with recruitment and retention,” he adds.
Saenz agrees that the survey’s findings on increasing use of automation are consistent with larger market trends. However, he adds that while clients often use technology to drive productivity and address labor scarcity, doing more with less labor is not the only goal.
Many are also looking to improve accuracy and service levels with new systems, as well as with strategies like changes to DC networks, better inventory management to have the right goods in stock, or by use of third-party logistics provider (3PL) resources.
“Operations can’t lose focus on customer satisfaction,” says Saenz. “They not only need to ship orders on time, but they must ensure orders are accurate because their customers in turn need to have products available, or consumers will buy from someone else. It’s all interconnected.”
Space utilization:The most congested area in warehouses
Source: Peerless Research Group (PRG)
Leasing additional space during peak season
Source: Peerless Research Group (PRG)
Operations characteristics
On the inbound side for 2023, 18% handle full pallet only, compared to 24% last year, while 29% said they deal with full pallet and case, down from 31% last year. Additionally, 45% say they deal with a mix of full pallet, case and split case inbound, while 8% deal with case and split case, for a combined 53% handling case and split case to some degree on the inbound.
On the outbound side, 12% say they deal with full pallet only, down from 17% in 2022, while 30% ship out full pallet and case, up from 17% last year. Meanwhile, 33% said they ship a mix of full pallets, cases, and split case, up just 1% from last year; 19% ship case and split case, compared to 24% last year; and 6% do split case only outbound, down from 10% last year.
In terms of total square footage in the DC network, the average square footage came to 479,565, up from 413,935 sq. ft. last year, while the median came in at 250,000, up from 245,000 last year. Keep in mind, however, that this year’s respondent pool came from companies with larger annual revenue size (median annual revenue was $175 million, up from $100 million in 2022), which likely influenced some findings.
When we asked about the most common square footage in the network, the overall average was 169,140 sq. ft., down just slightly from 169,550 sq. ft. last year. When there are three or fewer DCs in the network, the average square footage was 227,100 this year, compared to 252,727 in 2022. When the network has four or more buildings, the average this year was 423,315 sq. ft., down from 787,500 sq. ft. last year.
When it comes to number of buildings in the DC network, 32% this year said that they had just one; 17% had two; 8% said three buildings; and 43% reported more than three buildings in the network. Last year, 31% said they had more than three DCs, whereas 29% last year said they had two buildings, 12% higher than this year.
We ask about clear height of buildings in terms of what is common clear height in the network, giving respondents five ranges to select from: under 20 feet; 20 feet to 29 feet; 20 feet to 39 feet; 40 feet to 49 feet; and 50 feet or higher. This year, the average came in at 31.3 feet, up a bit from 30.6 feet last year. Those saying the most common height was 20 feet or less declined from 22% last year, to 14% this year, the biggest year over year shift by range.
There was a leap in the number of employees in the main DC, from an average of 75 last year, to 132 this year. Again, we present ranges for this question. This year, for example, 7% said they had between 500 people and 999 people in the main DC, compared with just 1% of respondents last year, which contributed to the year’s average being higher than in 2022.
E-commerce and channels
DC operations are shaped by channel strategies and the nature of fulfillment requirements, whether that be filling online orders headed to consumers, business customers, or more frequent, smaller orders for retailers.
While wholesale continues to be the top channel serviced, named by 55% this year, 36% of respondents this year say they are involved in e-commerce fulfillment, while 30% say they have omni-channel responsibilities, 1% higher than last year. Those saying they have an e-commerce channel was down by 5% versus last year’s 41%; but at the same time, there was a slight increase in those saying they’re involved in micro-fulfillment delivery to customers—19% this year, up from 15% in 2022.
Percent of workforce who are temporary during peak volume periods
Source: Peerless Research Group (PRG)
When we asked about how channels are being fulfilled, one notable shift was that 14% say that they use a 3PL for e-commerce and their own DCs for other channels, up from 8% last year.
We also ask by what percentage has e-commerce grown in the past 12 months. On this question, there was a significant jump in those saying e-commerce grew between 20% and 29%, garnering a 28% response, up from 15% last year.
Retention improvement labor management practices
Source: Peerless Research Group (PRG)
Those saying e-commerce grew 60% or more also rose from 2% last year to 9% this year. Of course, e-commerce activity can influence many things, from order picking strategies to design for the DC network or the need to tap 3PLs.
The “most congested” area of the warehouse this year was storage, with a 30% response, up from 19% last year, followed by receiving (22%) and shipping (20%). Last year, 27% named receiving as the most congested area.
E-commerce channel growth in past 12 months
Source: Peerless Research Group (PRG)
Inventory and storage
The average annual inventory turn figure improved by just over a full turn this year, going from 7.1 turns, to 8.2. That’s on par with the 2020 average, and the highest since then. Meanwhile, the average number of SKUs among respondents was 8,494, dipping from last year’s average of 10,371.
Additionally, while asked about DC expansion plans, 33% said they want to improve annual inventory turns, up from 24% last year. In fact, while there was a net 83% of respondents planning some area of expansion, the only area of expansion to climb versus last year was inventory turns. Thirty-seven percent say they plan to add employees, down from 41% last year, while 33% plan to add square footage, up by 1%.
The average peak warehouse space utilization fell from 85.6% last year to 78.5% this year. However, 25% answered that they are between 85% to 94% full on space during peak, 16% say they were between 95% to 100% full at peak, and 5% answered they were 100% full or over.
“When you have that significant a percentage at 85% capacity or over, you really need to be planning ahead on space needs,” notes Derewecki. “Proper planning becomes even more important today because of the cost of warehouse space.”
The survey also asks if, within the past five years, the operation leased additional space during peak times. This year, 24% say yes they have every year, down from 36% last year; 45% say they have a few times, up from 23% among last year’s respondents, while 31% say no, down from 41% last year.
When it comes to the percentage of workforce who are temps during peak, the average this year was 14%, down from 20% in 2022—and also below the 2021 average of 18.3%. Still, 10% indicate that 50% of the workforce were temps during peak, though a quarter indicate that they didn’t use temporary labor at all during peak.
As for methods of finding temporary workers, use of temp agencies led the way at 34%, with on-call workers used by 16%; staffing agencies by 16%; gig worker platforms by 13%; and contract firms by 8%. This is the second year we asked about use of gig worker platforms, and use of these held steady at 13%.
Distribution center expansion plans: Planning to expand over next 12 months
Source: Peerless Research Group (PRG)
Distribution center expansion plans: Areas for expansion
Source: Peerless Research Group (PRG)
We asked about annual employee turnover rate this year. Surprisingly, 36% indicate zero turnover, and 24% say it was under 10%. However, a combined 22% report turnover being 30% or higher.
In terms of retention improvement practices (multiple answers permitted), the leading practice was increased base pay, at 27%, followed by cross-training at 22%; bonus or recognition programs are used by 19%; incentive pay used by 13%; and 10% view placing workers into upskilled positions working with robotics or automation as a retention practice.
Systems and metrics
While PRG conducts a separate survey on equipment spending outlook, this operations study does offer some positive findings on capex budgets and broader use automation. For one thing, projected capex budgets held up.
This year, respondents had an average capex projection of $1.15 million for the coming year, down just a hair from last’s year’s average projected capex of $1.17 million. The median actually rose a bit, from $360,500 last year, to $367,250 this year. Looking at budget ranges indicated for 2023, just over one in four (26%) are planning to spend $1 million or more on equipment and technology this year.
Market channels serviced by company
Source: Peerless Research Group (PRG)
Do you have 100% SKU weight and dims in your item master?
Source: Peerless Research Group (PRG)
There were numerous signs of growing technology adoption, including the following.
- When asked about use of warehouse management systems (WMS) and related software, net use of a system reached 84%, up from 79% last year. Additionally, use of cloud-based WMS reached 12%, up from 5% last year.
- Use of labor management systems (LMS) functions reached 15%, up from 12%, while use of slotting software hit 12% this year, up from just 3% last year.
- When we asked about materials handling systems in use, both automated and manual, use of autonomous mobile robots (AMRs) and automated guided vehicles (AGVs) shot up to 20% this year, from 7% last year, while use of robotic arms/work cells reached 23%, up from 10%.
- In terms of other systems in use, deployment of conveyors reached 41% this year, up from 31%; while use of vertical lift modules grew from 25% last year to 34% this year. Use of shuttles reached 13%, up from 4%.
- When asked about picking technologies, use of voice-directed solutions jumped from 6% last year to 21% this year. A separate question on order filling techniques also found a 10% increase in the use of batch picking, up from 29% last year to 39% this year.
- When we asked about productivity metrics in use, 84% say that they use some type of metric, up from 82% last year, but below the 88% response back in 2021. This year, 48% say they tracked orders per hour, up from 38% last year. There were also slight increases in those tracking cases per hour, and in use of engineered standards.
We also asked about metrics used to manage DC operations, and overall, we found that a net 95% were using a metric of some type, up from 90% last year. In terms of metrics with increased response this year versus last, the only one that rose was on-time shipping, leveraged by 58% this year, up from 52% last year.
Most other metrics were down slightly in reported use, including tracking the perfect order metric. This is a composite metric, which according to the Warehouse Education Research Council, that tracks that orders are complete, on-time, damage free, and correctly documented.
Metrics are powered by data, and in this year’s survey, we found a slight decrease in those who tap their WMS or other systems to automatically collect data, standing at 51% this year, down from 53% last year.
Both Saenz and Derewecki point out that systematic use of metrics is becoming more important to managing DCs, and they advise it’s crucial to not only measure throughput, but to consider composite measures like a perfect order metric, to improve the customer experience.
“The Amazon effect has drifted down to the individual consumer, so everyone expects perfect everything on all orders. The same holds true with B2B fulfillment as well. If you’re shipping a 100-line order to a construction site and 95 of those lines arrive in good condition, but five lines are wrong or broken, you could stop the entire project.” - Derewecki
Top challenges
The findings on major issues making an impact on DC operations were, for the most part, led by perennial concerns like inability to attract and retain sufficient hourly workforce. But overall, the hot button issues trended to moderate to a bit lower than a couple of years ago when the pandemic crisis first hit.
While the challenge of finding and retaining hourly workers still garnered the second highest percentage, with 42% calling it a major issue, it trailed insufficient space, which was named by 44% this year. Perhaps connected to that, 35% say outdated storage, picking and material handling equipment was a major issue, 1% higher than last year.
Other issues with rising response levels this year include inadequate information systems capabilities, cited by 26%, up from 18% last year. Meanwhile, 26% see obsolete DC layouts as a top concern, up 3% from last year.
Warehouse management systems in use
Source: Peerless Research Group (PRG)
Estimated capital expenditures for warehousing equipment and technology in 2023
Source: Peerless Research Group (PRG)
Lack of SKU weight and dimensions (aka “dim”) also rose as a concern, but only up by 3%. A more encouraging finding, in terms of signs that global supply chain snarls have moderated, was that this year, only 31% call “supply chain disruptions, particularly with China,” a major issue, which was down sharply from 47% last year, when we first listed it as an issue to rate.
When we asked about actions taken to lower DC operating costs, 96% had taken some form of action, 4% higher than last year. Those adding automation to processes grew from 19% last year to 21% this year, but non-technology actions like improving warehouse processes—named by 71%, up from 66%—and changing layouts were also on the rise.
We ask every year about whether respondents believe they have accurate weights and dims in their item masters, and this year, 58% say yes, down from the 66% who answered yes on this question last year.
Each year the survey also asks if your supply chain operation has experienced a catastrophic event of some type (including extreme weather like hurricanes, or events like strikes or supplier failures) in the past two years. This year, 23% of respondents say they had experienced a catastrophic event in the past two years, while 77% say no. Last year, that breakdown was 32% who said yes, and 68% who said no.
Productivity metrics in use
Source: Peerless Research Group (PRG)
Overall, operations are looking at technology to raise their level of both productivity and service, says Saenz, but higher interest rates have increased the cost of capital, which tends to make operations more reluctant to put in new systems versus when rates were near historic lows.
In some cases, adds Saenz, it makes sense to apply budget to maintaining or upgrading older systems. “You can’t just focus on the shiny new technologies,” he adds. “You need to keep your eye on the health of your existing systems and buildings, and ensure that they’re going to remain productive for the next 10 years to 20 years.”
SC
MR

More WMS
- NextGen Supply Chain Conference unveils agenda focused on AI, execution and the future of leadership
- Wayfair executive to share lessons from building a tech-driven delivery network in NextGen Keynote
- Eli Lilly’s Mar Gimeno to keynote at NextGen Supply Chain Conference 2026
- Your 3PL has EDI, and then what?
- NextGen extends 2026 award, speaker submission deadlines amid strong industry interest
- Amazon Supply Chain 101: Enabling efficiency and growth for businesses everywhere—and everywhere they sell
- More WMS
Latest Resources
 Explore
Topics
Business Management News
- Why companies blame the wrong supplier … and miss the real failure
- NextGen Supply Chain Conference unveils agenda focused on AI, execution and the future of leadership
- Supply chain resilience isn’t a data problem; it’s a judgment problem
- Beyond the hype: Building flexible and scalable supply chains in a VUCA world
- Why your supply chain risk management plan will fail
- What options do you really have? Shaping the supply chain resilience funnel
- More Business Management
Latest Business Management Resources
About the Author
Roberto Michel, Editor at Large
Roberto Michel, senior editor for Modern, has covered manufacturing and supply chain management trends since 1996, mainly as a former staff editor and former contributor at Manufacturing Business Technology. He has been a contributor to Modern since 2004. He has worked on numerous show dailies, including at ProMat, the North American Material Handling Logistics show, and National Manufacturing Week. You can reach him at: [email protected].
Follow SCMR on social media.
@SupplyChainManagementReview on Facebook
@SCMR on Twitter
SCMR on Linkedin
Subscribe

Supply Chain Management Review delivers the best industry content.

Editors’ Picks