Sorry, but your login has failed. Please recheck your login information and resubmit. If your subscription has expired, renew here.
November 2021
This is the last regular issue of Supply Chain Management Review for 2021. Normally this time of year, I look forward to what’s in front of us. That’s turned out to be a fool’s errand over the last year and a half. So, instead, I looked back to see what I wrote this time last year. My column was titled “COVID hasn’t stopped supply chain progress.” Browse this issue archive.Need Help? Contact customer service 847-559-7581 More options
Upon first glance at some of the key findings from our annual “Warehouse Operations & Trends Survey,” industry participants are riding a pretty strong wave. Budgets are up, there are more respondents saying they’re “adding staff” as well as planning for more buildings and square footage.
But on closer look, our research team finds deep strains in the world of warehouse operations, led by pandemic repercussions like massive supply disruptions and a highly challenging labor market. These macro-trends run smack into operations at the warehouse and distribution center (DC) level, where managers need to find a way to accommodate growing e-commerce fulfillment volumes and control inventory as best possible in a time of supply shortages.
The survey, conducted annually by Peerless Research Group (PRG) on behalf of Logistics Management and sister publication Modern Materials Handling, asks about operational factors at DC and warehouses, such as size of the DC network, number of employees, average annual inventory turns, use of temporary labor, strategies for coping with peak demand, and other challenges such as finding and retaining labor. This year, the survey drew 144 qualified responses from professionals in logistics and warehouse operations across multiple verticals.
First, let’s start with some encouraging aspects of the survey because we’ve all heard about supply chain wide trends like microchip shortages.
The good is as follows:
- Our findings around budgets for warehouse systems and technology are up significantly.
- Higher percentages of respondents (compared to last year) plan to expand in areas like more employees, buildings and square footage.
However, we’re far from basking in normal growth mode because pandemic challenges remain with us. Inventory turns, which had been trending up in recent years, are down—likely tied to supply disruption and the decision to buffer more inventory as an enterprise strategy. Inability to find and retain labor, always a top challenge in our survey, grew even faster this year as the top concern.
There were also some unexpected findings, like more reliance on paper-based and manual processes; but on the whole, those involved with DC operations are planning to respond to disruption by applying more automation while fining-tuning their processes.
A greater readiness to adopt automation is part of the industry response to disruption, according to Norm Saenz, Jr., a partner and managing director with St. Onge, and Don Derewecki, a senior consultant with St. Onge, a supply chain engineering and consulting company and long-time partner with PRG on this survey project. Both of them examined the findings from our survey, and note the challenges are formidable, while the data point to more use of automation.
“Normal supply chain flows remain significantly disrupted, which of course impacts DC operations,” says Derewecki. “As for the labor availability issue, it was already a problem in recent years, and now it’s accelerating. All of these macro trends are getting company leaders more motivated to mechanize or automate more processes, because they know that can’t count on getting enough people into the building to run a largely manual operation.”

Operational shifts
Before getting into facility and workforce findings, it’s notable that the march toward more e-commerce is once again reflected in the survey because we ask about channels serviced, including e-commerce, omni-channel, and for the second year running, micro-fulfillment.
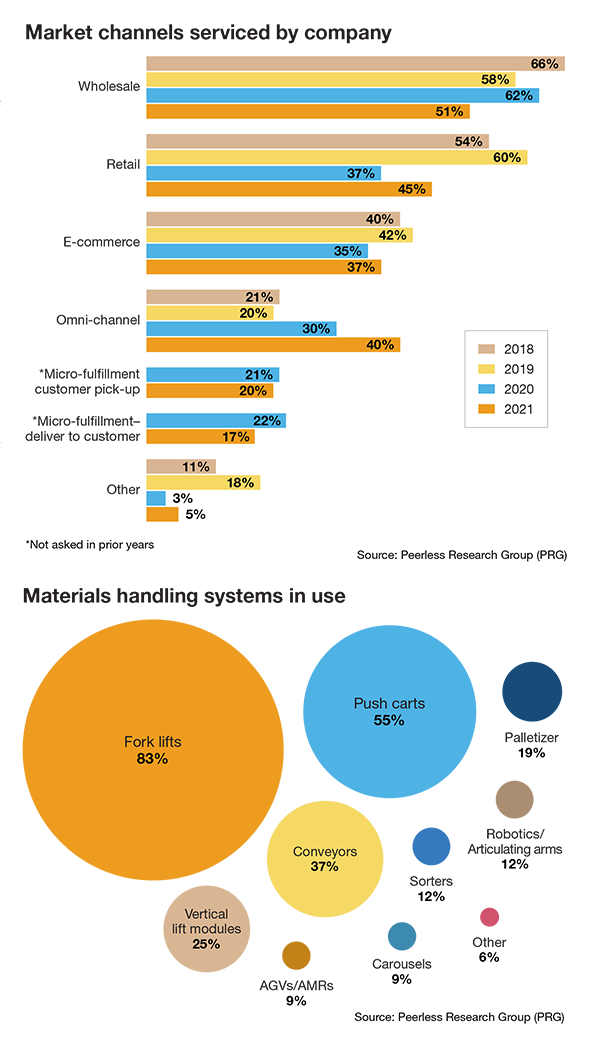
Wholesale remains the most common channel, supported by 51% this year, down from 62% last year. Retail as a channel was named by 45%, up from 37% last year. Thirty-seven percent named e-commerce a channel this year, up just 2% from last year, but 40% said they had omni-channel responsibilities, up 10% from last year and the highest level in the past four. Additionally, 20% are with companies involved with micro-fulfillment customer pickup, and 17% checked off micro-fulfillment with delivery to customers.
The nature of respondents’ inbound and outbound operations continues to shift in ways consistent with e-commerce. On the inbound side, 17% this year said that they’re dealing with case and split case, up from 8% last year. Full-pallet only grew 1% versus last year, but the rise in case and split case inbound may indicate that more DCs are seeing e-commerce returns and smaller replenishments as part of e-commerce fulfillment changes.
On the outbound side, the changes weren’t dramatic, though this year only 8% ship out full pallet only, down from 14% last year. Additionally, half of the respondents this year said they do full pallet case and split case outbound, up from 44% last year.
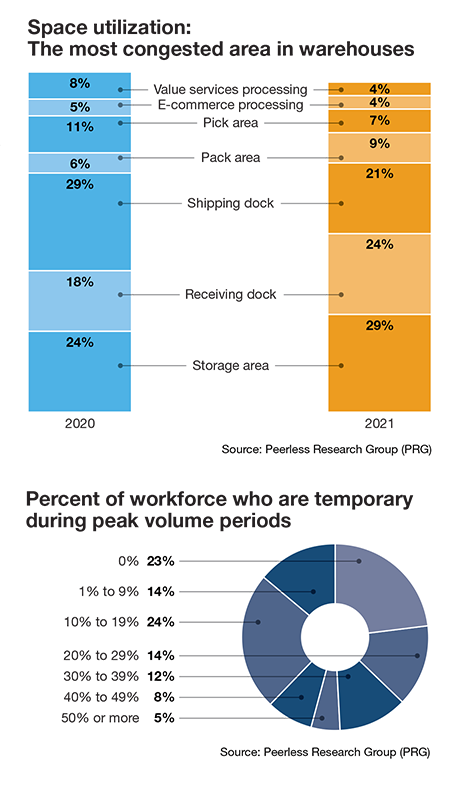
When we asked about space utilization and the most congested area in a warehouse, another notable change this year is that 24% named receiving, up from 18% last year. The e-commerce processing area was named by just 4%, down 1% from 2020, while storage, at 29% this year, was 5% busier than in 2020’s findings.
The shift to more complexity on the inbound side is something Saenz sees among clients, as more operations are dealing with an e-commerce surge.
“The concerns about e-commerce are real,” says Saenz. “It’s growing, and it’s just flipping the script for some companies whose facilities were designed around wholesale or retail-sized orders. Some companies have managed to sort of shoehorn-in e-commerce processes, but now it’s going to be driving everything from facility design to technology investment, just to be able to handle all of this e-commerce growth.”
When asked how multiple channels are being fulfilled, the most common strategy remains to self-distribute from one main DC, named by 41% and up from 37% last year. Last year, self-distributing from separate DCs for different channels saw a big gain (to 36%), but this year it dropped back to 21%. While there was a slight drop in those saying they use a 3PL for all channels, 11% use a 3PL for e-commerce, up from 3% in 2020.
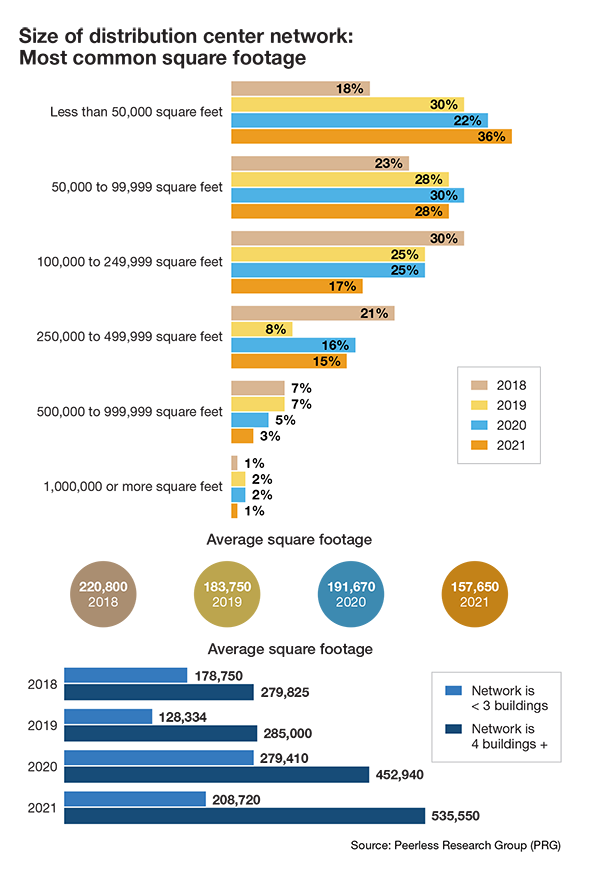
In terms of total square feet in the DC network, the average square footage was 570,395, down slightly from last year’s average of 609,325 square feet. The big change this year was that just 13% said total network square footage fell between 500,000 to 999,999 square feet, whereas last year 27% said so.
When we asked about the most common square footage in the network, the overall average fell from 191,670 square feet last year to 157,650 this year. However, average square footage was on the upswing for those with four-plus DCs—from 452,940 square feet last year to 535,550 square feet this year. As Derewecki notes, it may be that rather than a definite trend toward smaller buildings for all, it appears to be a trend toward larger operations needing larger buildings, though some companies may be opening some smaller sites to get goods positioned closer to customers.
The findings on number of buildings in the DC network remained fairly stable compared to last year. This year, 43% have more than three buildings, just 3% less than last year, while 15% have two buildings, up by 4% from 2020. Of those with three-plus buildings, the percentage having six or more nodes was 28% this year, down by 2% from 2020.
The findings on clear heights of buildings stayed fairly even. This year, the average clear height given the ranges presented was 31.1 feet, just lower than last year’s 32 feet, and level with 2019’s finding. There was a model increase in those reporting clear heights in the 40-foot to 49-foot range, but a 10% decrease in those with DCs in the 30-foot to 39-foot range.
Inventory issues
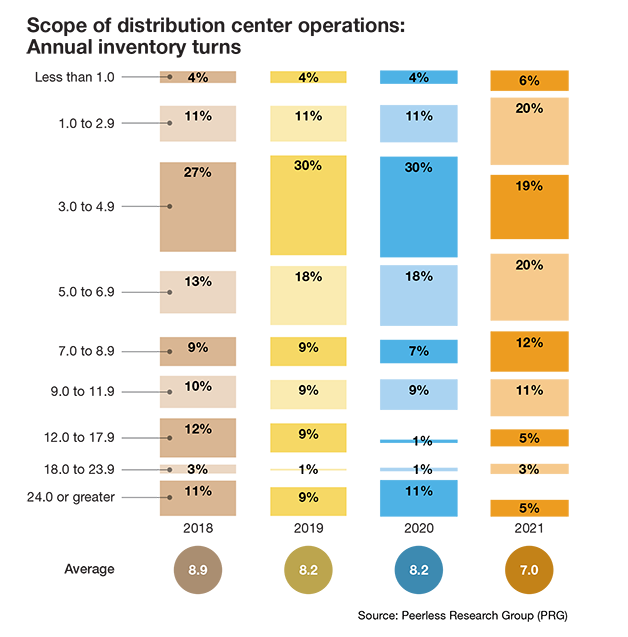
The tendency to hold inventories at higher levels to hedge against supply disruption is likely at play with the survey’s results on inventory turns.
This year, average annual turns came in at 7.0, down from 8.2 turns last year and as high as 8.9 turns back in 2018. “Due to these supply disruptions, which many feel will continue into 2022, we’re seeing a move away from just-in-time inventory strategies, to more of what you could call a ‘just-in-case’ approach,” says Derewecki.
Our finding on average SKU numbers fell a bit this year, after growing last year. This year, the average was 9,376 SKUs, down from 12,922 in 2020. Again, it’s a different set of respondents drawn from the reader base, but this decline does go against the notion of a “long tail” of inventory to accommodate the needs of e-commerce buyers.
One contributing factor, explains Saenz, is that ongoing supply disruption has caused many operations to refocus on a smaller number of SKUs representing their fastest movers. “It will be interesting over the next couple of years if a trend toward less SKUs is real, or a shorter-term trend that won’t stick once these supply chain disruptions have settled down,” he says.
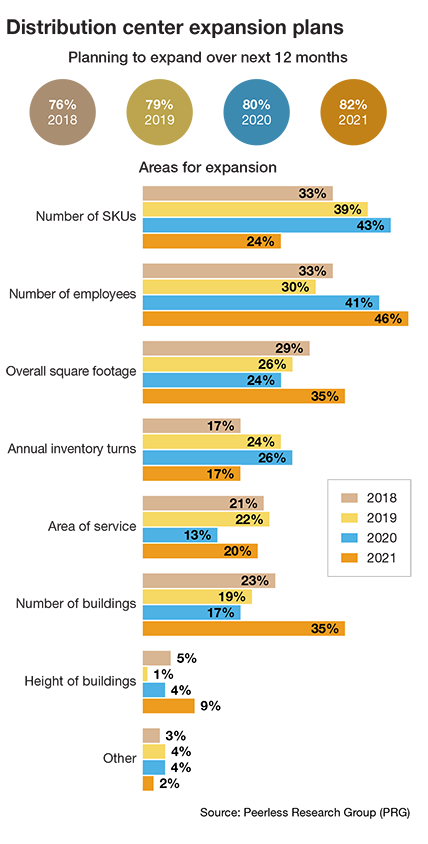
One of the most encouraging findings was in regard to expansion plans. This year, 82% said that they plan expansion of some type (such as SKUs, employees, square footage, etc.), up from 80% last year and the highest number in the last four years. This year, 35% said that they plan on an increase in square footage in the next 12 months, 11% higher than last year.
Also up are plans for more buildings—35% this year versus 17% in 2020—and a 5% increase in those saying that they plan to increase the number of employees.
However, there was a nearly 20% decline in those saying that they would increase SKU counts, and a 9% decrease in those expecting increased inventory turns. The story here may be that many respondents know they need more space and people to fulfill orders for customers, but there are lingering concerns about supply disruption.
As we’ll address later, labor availability remains the biggest operational concern, even though the number of employees in the main DC grew significantly this year in the survey, likely tied to growing e-commerce fulfillment work, which is labor intensive without automation. For 2021 that average climbed to 150 employees from 125 people last year. This year, 24% have between 50 employees to 99 employees in the main DC, and a combined 8% have 500 or more people at the main site.
The peak warehouse utilization finding also grew, on average, from 81.7% in 2020, to 85.4% in 2021. This year, 65% of respondents, nearly two thirds, report utilization at 85% or higher.
Our survey also found that, on average, more operations are using a greater percentage of temporary labor during peak volume periods. The average this year is 18.3% of the workforce being temps, up from 15.3% last year. This year, a combined 25% of respondents say that during peak periods, the percentage of temporary labor is 30% or greater.
E-commerce fulfillment is generally more labor intensive than wholesale or retail fulfillment, with more handling of each. When we asked what type of growth ranges respondents have seen for e-commerce, a third said that growth has been under 10%, but 21% said that it’s been between 20% to 29%, 12% say that growth has been between 30% and 39%, and a combined 14% peg it as 40% or higher.
COVID measures stick
We asked again about health and safety measures at DC sites in light of the ongoing pandemic, and we found that measures like mask wearing and social distancing remain in widespread use in 2021.
For example, 82% say masks are worn, and 76% practice some social distancing in certain areas. Additionally, 36% say they plan to continue their COVID health and safety practices, and 59% said partial or select measures would stay in place.
For the second year running, we also asked about actions taken since March 2020 to adjust operations in light of pandemic conditions. This year, the most frequently cited adjustment (57%) was to improve warehouse processes, followed by increase wage rates to attract and retain staff—48% this year, versus 42% last year. This year, 42% named warehouse information technology (IT) and software as an area for adjustment, up from 21% last year.
Likely due to the number of wildfires, hurricanes and other severe weather events seen in 2021, this year 36% said that they had experienced a catastrophic event in the past two years, up from 23% last year.
Our annual survey traditionally always asks about actions taken to lower operating costs. For 2021, the survey found that 92% have taken some form of action to lower costs, down from last year’s 98%.
Among the more specific actions taken to lower costs, 66% are improving warehouse processes, which was the top response. This year, 39% are improving warehouse IT and software, up by 4%, while improved inventory control was cited as an action to lower costs by 55%, down sharply from last year’s 69%.
Capex on the upswing
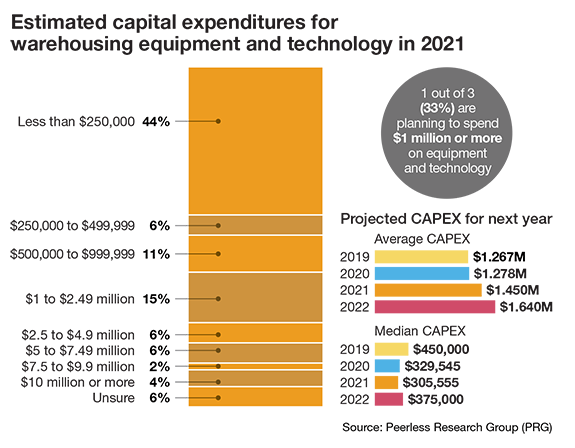
Perhaps the leading bright spot in this year’s survey are the findings around capital expenditures (capex) operations, as well as strong interest in materials handling systems and technology. Companies may be scrambling, but at least there’s budget to be applied to their challenges.
The average capex budget for equipment and technology reached $1.64 million for 2021, up from $1.45 million in 2020. The median capex also increased, from $305,555 last year to $375,00 this year. We ask for budget ranges, and this year there was a higher percentage of respondents with larger budgets. A combined 33% have budgets exceeding $1 million, compared to a combined 25% in excess of $1 million last year.
As mentioned, in terms of actions to lower costs, there was a 4% increased focus on using warehouse IT and software. Adding automation equipment to processes was cited by 19% this year, down from 25% in 2020.
Meanwhile, 83% report using a warehouse management system (WMS) of some type, down slightly from the 85% level for use of a WMS seen in 2019 and 2020. The most frequently cited type of WMS is a WMS module of an enterprise resource planning (ERP) system, followed by legacy or in-house developed WMS, followed by a best of breed WMS.
When we asked about material handling systems currently in use, there were other signs of increased technology adoption. For example, use of robotics/articulating arms reached 12% this year (from 9% last year), while use of automated guided vehicles (AGVs) and autonomous mobile robots (AMRs) reached 9%, up from 6% last year.
There were some findings contrary to a more rapid embrace of technology, such as an increase in paper-based picking, up to 59% this year from 46% last year. Use of voice directed systems did climb this year by 2% to reach 9%. Similarly, when asked about data collection methods used to gauge productivity, there was a rise in manual data collection—at 59% this year from 43% last year.
While one year’s findings on paper-based approaches is difficult to tie into one reason, other than a different set of respondents, it may be that the unusual supply shortages and rapid adjustments to warehouse workflows or SKU mixes experienced by operations during this second year of the pandemic may have contributed to more use of paper-based systems or data collection.
When we asked about productivity metrics in use, 88% said they use some type of metric, up 1% from 2020. In terms of type of metrics used, percentage of an engineered standard dropped sharply to 11% from 22% last year. However, units/pieces per hour as a metric was up to 41% from 30% in 2020, and lines per hour and cases per hour as metrics also some modest percentage increases.
Technology adoption also supports and ties in with certain order-filling techniques, such as batch picking, wave picking, and the use of put wall systems. We found that put-walls, which typically are software-driven and light directed, are in use by 8%, while batch picking is used by 40% this year, nearly even with last year’s 41%.
As Saenz notes, expect greater use of technology-enabled order filling methods like batch picking or put walls as the proportion of e-commerce fulfillment work increases, and a decrease in straight line order picking. “There’s just no way to handle e-commerce fulfillment efficiently without batch picking technology and capabilities,” says Saenz.
Labor tops concerns
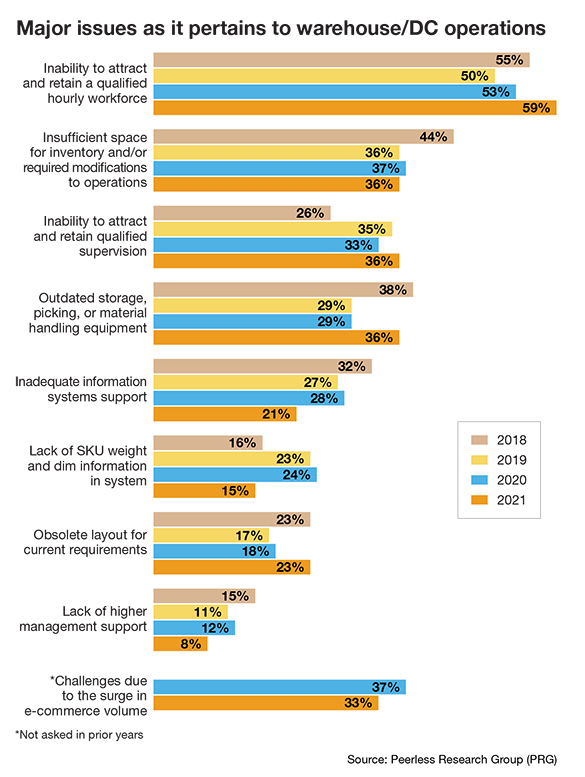
Over the last four years, inability to attract and retain a qualified hourly workforce was already the most frequently cited industry issue impacting DCs. This year, it was even more so, with 59% naming it the top concern, up from 53% last year, and the highest in the past four years.
Three other issues tied at 36% as the second most frequently cited concern in 2021: insufficient space; attracting and retaining qualified managers, and outdated storage and material handling equipment, which was up a fairly significant 7%.
Underscoring the concern about labor is that when we asked about WMS use we also asked about related software including labor management/planning (LMS). This year, 8% report use of LMS, up from 4% in 2020, though not as high as the two previous years.
For the second year running, we asked if challenges tied to a surge in e-commerce constituted a major operational issue. This year, 33% agreed it was a major concern, down from last year’s 37%. One positive trend here is that this year, only 8% cited “lack of higher management support” as a major issue, down from 12% in 2020, and as high as 15% who felt that way in 2018.
Automation as response
Overall, the 2021 survey shows that readers tend to have bigger capex budgets and a healthy interest in technology, but face big strains when it comes to finding and keeping labor, slower inventory turns, and more respondents with a space capacity issues during peak times.
More deployment of technology could be the answer, say Saenz and Derewecki, although there’s also typically some low hanging fruit with layouts or process improvements that could help those without growing budgets.
Saenz explains that the current pain points have led to some ironies, such as operations that keep temp workers on staff even when they don’t absolutely need them at the moment because getting more labor into the building when needed is no sure bet—so it’s seen as less risky to operational viability to keep them on.
In this climate, greater use of automation to help with reliable throughput and reduce reliance on manual processes is to be expected. Signs of faster-paced tech adoption is reflected in findings like the higher capex levels, adds Saenz, but he also sees it in interactions with clients.
As Saenz sums up: “There’s never been a time when so much automation and different warehouse technologies are being evaluated in every one of our projects—and in industries you wouldn’t think of as deploying technology heavily. In the past, people would talk about the potential benefits of more automation, but now more companies are considering it strongly. It all ties into the challenges around labor, and the growth in e-commerce.”
SC
MR
Sorry, but your login has failed. Please recheck your login information and resubmit. If your subscription has expired, renew here.
November 2021
This is the last regular issue of Supply Chain Management Review for 2021. Normally this time of year, I look forward to what’s in front of us. That’s turned out to be a fool’s errand over the last year and a… Browse this issue archive. Access your online digital edition. Download a PDF file of the November 2021 issue.Upon first glance at some of the key findings from our annual “Warehouse Operations & Trends Survey,” industry participants are riding a pretty strong wave. Budgets are up, there are more respondents saying they’re “adding staff” as well as planning for more buildings and square footage.
But on closer look, our research team finds deep strains in the world of warehouse operations, led by pandemic repercussions like massive supply disruptions and a highly challenging labor market. These macro-trends run smack into operations at the warehouse and distribution center (DC) level, where managers need to find a way to accommodate growing e-commerce fulfillment volumes and control inventory as best possible in a time of supply shortages.
The survey, conducted annually by Peerless Research Group (PRG) on behalf of Logistics Management and sister publication Modern Materials Handling, asks about operational factors at DC and warehouses, such as size of the DC network, number of employees, average annual inventory turns, use of temporary labor, strategies for coping with peak demand, and other challenges such as finding and retaining labor. This year, the survey drew 144 qualified responses from professionals in logistics and warehouse operations across multiple verticals.
First, let’s start with some encouraging aspects of the survey because we’ve all heard about supply chain wide trends like microchip shortages.
The good is as follows:
- Our findings around budgets for warehouse systems and technology are up significantly.
- Higher percentages of respondents (compared to last year) plan to expand in areas like more employees, buildings and square footage.
However, we’re far from basking in normal growth mode because pandemic challenges remain with us. Inventory turns, which had been trending up in recent years, are down—likely tied to supply disruption and the decision to buffer more inventory as an enterprise strategy. Inability to find and retain labor, always a top challenge in our survey, grew even faster this year as the top concern.

There were also some unexpected findings, like more reliance on paper-based and manual processes; but on the whole, those involved with DC operations are planning to respond to disruption by applying more automation while fining-tuning their processes.
A greater readiness to adopt automation is part of the industry response to disruption, according to Norm Saenz, Jr., a partner and managing director with St. Onge, and Don Derewecki, a senior consultant with St. Onge, a supply chain engineering and consulting company and long-time partner with PRG on this survey project. Both of them examined the findings from our survey, and note the challenges are formidable, while the data point to more use of automation.
“Normal supply chain flows remain significantly disrupted, which of course impacts DC operations,” says Derewecki. “As for the labor availability issue, it was already a problem in recent years, and now it’s accelerating. All of these macro trends are getting company leaders more motivated to mechanize or automate more processes, because they know that can’t count on getting enough people into the building to run a largely manual operation.”

Operational shifts
Before getting into facility and workforce findings, it’s notable that the march toward more e-commerce is once again reflected in the survey because we ask about channels serviced, including e-commerce, omni-channel, and for the second year running, micro-fulfillment.
Wholesale remains the most common channel, supported by 51% this year, down from 62% last year. Retail as a channel was named by 45%, up from 37% last year. Thirty-seven percent named e-commerce a channel this year, up just 2% from last year, but 40% said they had omni-channel responsibilities, up 10% from last year and the highest level in the past four. Additionally, 20% are with companies involved with micro-fulfillment customer pickup, and 17% checked off micro-fulfillment with delivery to customers.
The nature of respondents’ inbound and outbound operations continues to shift in ways consistent with e-commerce. On the inbound side, 17% this year said that they’re dealing with case and split case, up from 8% last year. Full-pallet only grew 1% versus last year, but the rise in case and split case inbound may indicate that more DCs are seeing e-commerce returns and smaller replenishments as part of e-commerce fulfillment changes.

On the outbound side, the changes weren’t dramatic, though this year only 8% ship out full pallet only, down from 14% last year. Additionally, half of the respondents this year said they do full pallet case and split case outbound, up from 44% last year.
When we asked about space utilization and the most congested area in a warehouse, another notable change this year is that 24% named receiving, up from 18% last year. The e-commerce processing area was named by just 4%, down 1% from 2020, while storage, at 29% this year, was 5% busier than in 2020’s findings.
The shift to more complexity on the inbound side is something Saenz sees among clients, as more operations are dealing with an e-commerce surge.
“The concerns about e-commerce are real,” says Saenz. “It’s growing, and it’s just flipping the script for some companies whose facilities were designed around wholesale or retail-sized orders. Some companies have managed to sort of shoehorn-in e-commerce processes, but now it’s going to be driving everything from facility design to technology investment, just to be able to handle all of this e-commerce growth.”
When asked how multiple channels are being fulfilled, the most common strategy remains to self-distribute from one main DC, named by 41% and up from 37% last year. Last year, self-distributing from separate DCs for different channels saw a big gain (to 36%), but this year it dropped back to 21%. While there was a slight drop in those saying they use a 3PL for all channels, 11% use a 3PL for e-commerce, up from 3% in 2020.
In terms of total square feet in the DC network, the average square footage was 570,395, down slightly from last year’s average of 609,325 square feet. The big change this year was that just 13% said total network square footage fell between 500,000 to 999,999 square feet, whereas last year 27% said so.
When we asked about the most common square footage in the network, the overall average fell from 191,670 square feet last year to 157,650 this year. However, average square footage was on the upswing for those with four-plus DCs—from 452,940 square feet last year to 535,550 square feet this year. As Derewecki notes, it may be that rather than a definite trend toward smaller buildings for all, it appears to be a trend toward larger operations needing larger buildings, though some companies may be opening some smaller sites to get goods positioned closer to customers.
The findings on number of buildings in the DC network remained fairly stable compared to last year. This year, 43% have more than three buildings, just 3% less than last year, while 15% have two buildings, up by 4% from 2020. Of those with three-plus buildings, the percentage having six or more nodes was 28% this year, down by 2% from 2020.
The findings on clear heights of buildings stayed fairly even. This year, the average clear height given the ranges presented was 31.1 feet, just lower than last year’s 32 feet, and level with 2019’s finding. There was a model increase in those reporting clear heights in the 40-foot to 49-foot range, but a 10% decrease in those with DCs in the 30-foot to 39-foot range.

Inventory issues
The tendency to hold inventories at higher levels to hedge against supply disruption is likely at play with the survey’s results on inventory turns.
This year, average annual turns came in at 7.0, down from 8.2 turns last year and as high as 8.9 turns back in 2018. “Due to these supply disruptions, which many feel will continue into 2022, we’re seeing a move away from just-in-time inventory strategies, to more of what you could call a ‘just-in-case’ approach,” says Derewecki.
Our finding on average SKU numbers fell a bit this year, after growing last year. This year, the average was 9,376 SKUs, down from 12,922 in 2020. Again, it’s a different set of respondents drawn from the reader base, but this decline does go against the notion of a “long tail” of inventory to accommodate the needs of e-commerce buyers.
One contributing factor, explains Saenz, is that ongoing supply disruption has caused many operations to refocus on a smaller number of SKUs representing their fastest movers. “It will be interesting over the next couple of years if a trend toward less SKUs is real, or a shorter-term trend that won’t stick once these supply chain disruptions have settled down,” he says.
One of the most encouraging findings was in regard to expansion plans. This year, 82% said that they plan expansion of some type (such as SKUs, employees, square footage, etc.), up from 80% last year and the highest number in the last four years. This year, 35% said that they plan on an increase in square footage in the next 12 months, 11% higher than last year.
Also up are plans for more buildings—35% this year versus 17% in 2020—and a 5% increase in those saying that they plan to increase the number of employees.
However, there was a nearly 20% decline in those saying that they would increase SKU counts, and a 9% decrease in those expecting increased inventory turns. The story here may be that many respondents know they need more space and people to fulfill orders for customers, but there are lingering concerns about supply disruption.
As we’ll address later, labor availability remains the biggest operational concern, even though the number of employees in the main DC grew significantly this year in the survey, likely tied to growing e-commerce fulfillment work, which is labor intensive without automation. For 2021 that average climbed to 150 employees from 125 people last year. This year, 24% have between 50 employees to 99 employees in the main DC, and a combined 8% have 500 or more people at the main site.
The peak warehouse utilization finding also grew, on average, from 81.7% in 2020, to 85.4% in 2021. This year, 65% of respondents, nearly two thirds, report utilization at 85% or higher.
Our survey also found that, on average, more operations are using a greater percentage of temporary labor during peak volume periods. The average this year is 18.3% of the workforce being temps, up from 15.3% last year. This year, a combined 25% of respondents say that during peak periods, the percentage of temporary labor is 30% or greater.
E-commerce fulfillment is generally more labor intensive than wholesale or retail fulfillment, with more handling of each. When we asked what type of growth ranges respondents have seen for e-commerce, a third said that growth has been under 10%, but 21% said that it’s been between 20% to 29%, 12% say that growth has been between 30% and 39%, and a combined 14% peg it as 40% or higher.

COVID measures stick
We asked again about health and safety measures at DC sites in light of the ongoing pandemic, and we found that measures like mask wearing and social distancing remain in widespread use in 2021.
For example, 82% say masks are worn, and 76% practice some social distancing in certain areas. Additionally, 36% say they plan to continue their COVID health and safety practices, and 59% said partial or select measures would stay in place.
For the second year running, we also asked about actions taken since March 2020 to adjust operations in light of pandemic conditions. This year, the most frequently cited adjustment (57%) was to improve warehouse processes, followed by increase wage rates to attract and retain staff—48% this year, versus 42% last year. This year, 42% named warehouse information technology (IT) and software as an area for adjustment, up from 21% last year.
Likely due to the number of wildfires, hurricanes and other severe weather events seen in 2021, this year 36% said that they had experienced a catastrophic event in the past two years, up from 23% last year.
Our annual survey traditionally always asks about actions taken to lower operating costs. For 2021, the survey found that 92% have taken some form of action to lower costs, down from last year’s 98%.
Among the more specific actions taken to lower costs, 66% are improving warehouse processes, which was the top response. This year, 39% are improving warehouse IT and software, up by 4%, while improved inventory control was cited as an action to lower costs by 55%, down sharply from last year’s 69%.
Capex on the upswing
Perhaps the leading bright spot in this year’s survey are the findings around capital expenditures (capex) operations, as well as strong interest in materials handling systems and technology. Companies may be scrambling, but at least there’s budget to be applied to their challenges.
The average capex budget for equipment and technology reached $1.64 million for 2021, up from $1.45 million in 2020. The median capex also increased, from $305,555 last year to $375,00 this year. We ask for budget ranges, and this year there was a higher percentage of respondents with larger budgets. A combined 33% have budgets exceeding $1 million, compared to a combined 25% in excess of $1 million last year.
As mentioned, in terms of actions to lower costs, there was a 4% increased focus on using warehouse IT and software. Adding automation equipment to processes was cited by 19% this year, down from 25% in 2020.

Meanwhile, 83% report using a warehouse management system (WMS) of some type, down slightly from the 85% level for use of a WMS seen in 2019 and 2020. The most frequently cited type of WMS is a WMS module of an enterprise resource planning (ERP) system, followed by legacy or in-house developed WMS, followed by a best of breed WMS.
When we asked about material handling systems currently in use, there were other signs of increased technology adoption. For example, use of robotics/articulating arms reached 12% this year (from 9% last year), while use of automated guided vehicles (AGVs) and autonomous mobile robots (AMRs) reached 9%, up from 6% last year.
There were some findings contrary to a more rapid embrace of technology, such as an increase in paper-based picking, up to 59% this year from 46% last year. Use of voice directed systems did climb this year by 2% to reach 9%. Similarly, when asked about data collection methods used to gauge productivity, there was a rise in manual data collection—at 59% this year from 43% last year.
While one year’s findings on paper-based approaches is difficult to tie into one reason, other than a different set of respondents, it may be that the unusual supply shortages and rapid adjustments to warehouse workflows or SKU mixes experienced by operations during this second year of the pandemic may have contributed to more use of paper-based systems or data collection.
When we asked about productivity metrics in use, 88% said they use some type of metric, up 1% from 2020. In terms of type of metrics used, percentage of an engineered standard dropped sharply to 11% from 22% last year. However, units/pieces per hour as a metric was up to 41% from 30% in 2020, and lines per hour and cases per hour as metrics also some modest percentage increases.
Technology adoption also supports and ties in with certain order-filling techniques, such as batch picking, wave picking, and the use of put wall systems. We found that put-walls, which typically are software-driven and light directed, are in use by 8%, while batch picking is used by 40% this year, nearly even with last year’s 41%.
As Saenz notes, expect greater use of technology-enabled order filling methods like batch picking or put walls as the proportion of e-commerce fulfillment work increases, and a decrease in straight line order picking. “There’s just no way to handle e-commerce fulfillment efficiently without batch picking technology and capabilities,” says Saenz.
Labor tops concerns
Over the last four years, inability to attract and retain a qualified hourly workforce was already the most frequently cited industry issue impacting DCs. This year, it was even more so, with 59% naming it the top concern, up from 53% last year, and the highest in the past four years.
Three other issues tied at 36% as the second most frequently cited concern in 2021: insufficient space; attracting and retaining qualified managers, and outdated storage and material handling equipment, which was up a fairly significant 7%.

Underscoring the concern about labor is that when we asked about WMS use we also asked about related software including labor management/planning (LMS). This year, 8% report use of LMS, up from 4% in 2020, though not as high as the two previous years.
For the second year running, we asked if challenges tied to a surge in e-commerce constituted a major operational issue. This year, 33% agreed it was a major concern, down from last year’s 37%. One positive trend here is that this year, only 8% cited “lack of higher management support” as a major issue, down from 12% in 2020, and as high as 15% who felt that way in 2018.
Automation as response
Overall, the 2021 survey shows that readers tend to have bigger capex budgets and a healthy interest in technology, but face big strains when it comes to finding and keeping labor, slower inventory turns, and more respondents with a space capacity issues during peak times.
More deployment of technology could be the answer, say Saenz and Derewecki, although there’s also typically some low hanging fruit with layouts or process improvements that could help those without growing budgets.
Saenz explains that the current pain points have led to some ironies, such as operations that keep temp workers on staff even when they don’t absolutely need them at the moment because getting more labor into the building when needed is no sure bet—so it’s seen as less risky to operational viability to keep them on.

In this climate, greater use of automation to help with reliable throughput and reduce reliance on manual processes is to be expected. Signs of faster-paced tech adoption is reflected in findings like the higher capex levels, adds Saenz, but he also sees it in interactions with clients.
As Saenz sums up: “There’s never been a time when so much automation and different warehouse technologies are being evaluated in every one of our projects—and in industries you wouldn’t think of as deploying technology heavily. In the past, people would talk about the potential benefits of more automation, but now more companies are considering it strongly. It all ties into the challenges around labor, and the growth in e-commerce.”
SC
MR


More Automation
- Is your enterprise suffering from too much data?
- One door closes, a better one opens
- AI liftoff delayed?
- Chatbot is not the answer: Practical LLM use cases in supply chain
- Decision Intelligence and Causal AI are transforming the future of manufacturing
- Procter & Gamble’s Amy Rardin announced as NexGen Supply Chain keynote speaker
- More Automation
Latest Podcast
 Explore
Software & Technology News
- AI-driven sourcing: Why the speed of change is going to only accelerate
- Boeing turned to Fairmarkit, AI to help land its tail spend
- Is your enterprise suffering from too much data?
- Supply Chain 3.0: The power of connected data
- One door closes, a better one opens
- What really works in the digital supply chain?
- More Software & Technology
Latest Software & Technology Resources

Subscribe
Supply Chain Management Review delivers the best industry content.

Editors’ Picks


