As E-commerce continues to grow at double-digit rates in the United States and Amazon continues to offer a greater variety of goods with more delivery options the shipment of goods between a hub and the final delivery address, last mile delivery has assumed greater importance. Further, consumers have been pushing for greener solutions- these include sustainable logistics in addition to environmentally-friendly products. Customers are also demanding more in customer service. As a result, new solutions such as the option of delivery time windows or sophisticated reverse logistics operations are taking hold. Price, speed and service will drive the winners away from the also-rans.
In Tackling The Difficult Last Mile, an article we published in the December 2017 issue of the ISE magazine, we examined several innovative initiatives and solutions including smart routing tools, collection points, security boxes, smart city logistics, fuel efficiency improvements, and the use of smart vehicles. We adapted and enhanced a cost model originally developed by Roel Gevaers and his colleagues to estimate the average cost per unit delivered for the last mile, and then compared the results for different strategies across different geographical areas.
The cost model was run for a base case scenario that assumes a single delivery route, no time windows, no secure boxes, no collection points, no returns, no advanced vehicle and routing technologies and no fuel-efficient vehicles. While the specific costs obtained from the model are an approximation, the model provides valuable insights when different strategies are evaluated relative to the base reference model.
The base reference model for deliveries in the City of Chicago estimates average last mile costs per unit delivered (or last mile costs, for simplicity) as $2.66. This cost is indexed or represented as 100, and all other costs are scaled relative to this number. The average cost for deliveries in the Chicago Metropolitan Area for the same base reference scenario is $3.10, a 16.54% premium to the City. This is represented as an Index of 165.4. For deliveries covering the entire state of Illinois, the average cost is $4.30, a 61.65% premium to the City and an Index of 161.65.
Actions that affect last mile costs
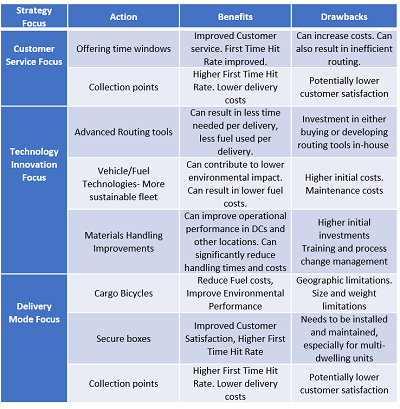
Figure 1 below highlights the actions that businesses can take to manage their last mile costs and service expectations, along with the benefits and drawbacks. Figure 2 shows the cost impact of some of the actions, if pursued individually. For example, some companies are offering time windows to enhance service and improve First Time Hit Rate (FTHR), or the percentage of first delivery attempts to a consignee that are successful.
We showed that while time windows significantly improve the FTHR, a four-hour time window increases costs by more than 20% relative to a no time window delivery. The cost of offering two-hour time windows in the city is cheaper than the base reference cost for deliveries across the entire state. This indicates that time windows could be offered in urban areas without a huge premium in costs.
Some companies are delivering to security boxes at residences or business locations. Others are offering collection points for customers. A city could promote the installation of secure boxes in every house; this action alone would decrease the costs of delivery by around 25% when no time windows are offered. Delivery to collection points only can reduce last mile costs by nearly 50%.
Shippers are also investing in Routing Tools that can increase productivity through the automation of daily route planning, and making real-time adjustments when needed. Firms are also considering eco-friendly delivery vehicles that use LPG, electricity or are hybrids. These can position the company as a sustainable firm and also impact the cost performance. However, the cost model shows that fuel efficient or eco-friendly fleets do not have a significant effect on last mile costs within the city. Instead, they are more meaningful when deliveries are made across the state. Using cargo bicycles for delivery in the city center show savings of 30% to 40% and the last mile costs can be competitive even if time windows are offered.
Returns represent a big threat to the last mile optimization. A returns rate of 8% can increase the overall delivery costs by up to 20%. Frequent returns of products may result in cost increases exceeding 50% and offering time windows for returns can more than double the cost. However, extensive use of collection points can significantly lower the cost of returns.
Last mile strategy
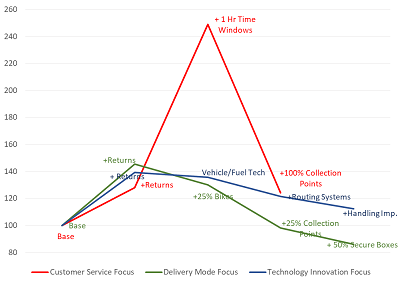
Retailers, direct-to-consumer manufacturers and others are pursuing combinations of last mile actions to gain a sustainable share in the marketplace. We modeled three different scenarios - a “customer service focus” scenario, a “delivery mode focus” scenario and a “technological innovations focus” scenario. The results are shown in Figure 3.
Based on our study, routing tools can have a significant impact on a logistics provider's costs. Although environmentally-sustainable fleets don't have a significant impact, these will become far more important if the costs of carbon emissions are included. Interestingly, using bikes for last mile deliveries to security boxes has a cost profile similar to that of collection points and increases customer service.
The key take-away for shippers and logistics providers is that excellent customer service, including short time-windows for delivery, can significantly raise costs. Companies should seriously evaluate the benefits gained by offering such service levels and whether the customers realize those benefits. Amazon, given its significant financial strength, has chosen to experiment with many actions. Its strategy, as evidenced by the changes to Amazon Prime over time through higher subscription fees and increasing minimum order sizes, is to gain customer loyalty first and then drive profitability. Companies that do not have such financial luxury need to carefully evaluate their customer service focus and try to mitigate the costs through the use of delivery mode improvements and technological innovations in order to avoid the logistics graveyard occupied by firms like Webvan.
Figure 1 Benefits and drawbacks of last mile actions
Source: The Authors
Figure 2: Cost Impact of Time Windows, Security Boxes or Collection Points

Source: ISE Magazine
Figure 3: Impacts of Customer Service, Delivery Mode and Technology Innovations on Last Mile Costs
Source: ISE Magazine
By Gurram Gopal is an industry professor of Industrial Technology and Management at the Illinois Institute of Technology. He can be reached at [email protected]. Alvaro de Miguel is a graduate student at the Illinois Institute of Technology.
SC
MR

Latest Supply Chain News
- Few executives believe their supply chains can respond quickly to disruptions
- Technology’s role in mending supply chain fragility after recent disruptions
- Tech investments bring revenue increases, survey finds
- Survey reveals strategies for addressing supply chain, logistics labor shortages
- Israel, Ukraine aid package to increase pressure on aerospace and defense supply chains
- More News
Latest Podcast
 Explore
Latest Supply Chain News
- Few executives believe their supply chains can respond quickly to disruptions
- Technology’s role in mending supply chain fragility after recent disruptions
- Tech investments bring revenue increases, survey finds
- Survey reveals strategies for addressing supply chain, logistics labor shortages
- Israel, Ukraine aid package to increase pressure on aerospace and defense supply chains
- How CPG brands can deliver on supplier diversity promises
- More latest news
Latest Resources

Subscribe
Supply Chain Management Review delivers the best industry content.
Editors’ Picks


