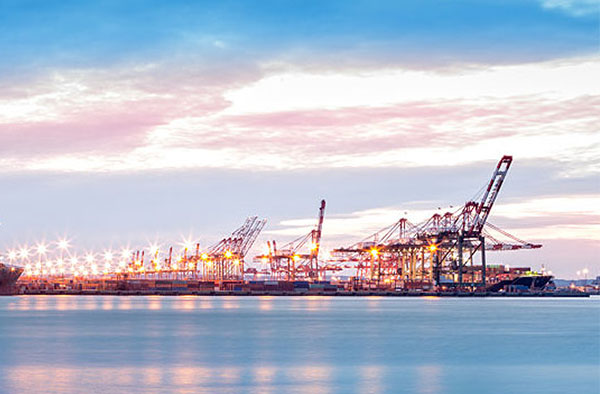
The Port of Los Angeles handled 650,977 Twenty-Foot Equivalent Units (TEUs) in March, an increase of 12.7 percent compared to 2018. For the first quarter of 2019, container volumes grew 4.6 percent.
“Despite global trade uncertainties, we experienced strong first quarter growth,” said Port of Los Angeles Executive Director Gene Seroka. “I commend our supply chain stakeholders who have processed record amounts of cargo in recent months and we anticipate greater efficiency improvement with the Port Optimizer that was rolled out in the first quarter. Retailers are forecasting an uptick in summer consumer demand and we are ready for those boxes.”
As reported in SCMR, GE' Transportation's Port Optimizer software is designed to enhance cargo flow as participating terminal operators and other stakeholders receive much improved advance notice of cargo arrival.
This information is coordinated with data on the availability of equipment, labor and other resources needed to move that cargo through the supply chain
March 2019 imports increased 12.4 percent to 297,187 TEUs compared to the previous year. Exports decreased 2.9 percent to 158,924 TEUs. Empty containers increased 30.2 percent to 194,866 TEUs.
For the first three months of 2019, Port volumes have increased 4.6 percent compared to the same period last year.
Descartes, a consultancy and software-as-a-service provider for logistics management, also recently broke down leading import commodities fueling growth at Los Angles along with the top countries of origin.
Brendan McCahill, senior vice president of trade data content at Descartes, told SCMR in an interview that while LA and its sister port, Long Beach, are still leading the pack of U.S. ocean cargo gateways, they can't afford to relax.
“It seems that some growth in trade actually may soon be directed to the east coast via the expanded Panama Canal,” he said. “We also see post Panamax vessels making a string via Suez, delivering more volume via the east coast.”
Along with this, Descartes sees investment in expansion of facilities on the east coast with more land available.
| Country of Origin |
Bills of Lading | Container Quantity |
Metric Tons | Teus Quantity | % of total | TEUs July 2017 | % change |
|---|---|---|---|---|---|---|---|
| CHINA | 4772155 | 5831281.43 | 72212470.86 | 10725744.53 | 12.05 | 22,212 | 9.35 |
| VIETNAM | 487122 | 603486.65 | 10645463.77 | 1142908.1 | 4.59 | 154,970 | |
| GERMANY | 459541 | 473872.26 | 10094148.8 | 852054.6 | 8.73 | 36,896 | 21.42 |
| HONG KONG | 417196 | 441268.11 | 5050134.15 | 811984.09 | 8.07 | 16,465 | 10.34 |
| SOUTH KOREA | 353523 | 470962.69 | 15945882.2 | 801037.62 | 6.85 | 39,725 | 29.38 |
| INDIA | 515526 | 467411.69 | 11754486.57 | 742777 | 7.22 | 15,358 | 10.78 |
| TAIWAN | 451213 | 424068.41 | 7083752.18 | 737654.08 | 7.81 | -7,566 | -4.91 |
| JAPAN | 264814 | 375958.24 | 15509492.23 | 667058.55 | 5.50 | 6,096 | 5.62 |
| THAILAND | 191567 | 326993.7 | 5038115.84 | 546143.29 | 5.52 | 5,190 | 4.77 |
| ITALY | 347206 | 315079.9 | 8103081.37 | 541143.32 | 4.04 | 12,086 | 15.17 |
| INDONESIA | 192234 | 217867.45 | 7169791.43 | 394939.27 | 4.08 | 2,629 | 3.27 |
| BRAZIL | 153897 | 256481.31 | 27966882.86 | 394613.78 | 2.72 | 7,525 | |
| GUATEMALA | 94645 | 171081.04 | 4330037.06 | 331035.55 | 2.22 | 9,907 | 22.66 |
| MALAYSIA | 104885 | 163544.04 | 3550011.88 | 299538.15 | 1.16 | 5,899 | 25.71 |
| FRANCE | 141128 | 148872.13 | 4237020.15 | 267148.14 | 1.05 | 1,432 | 6.93 |
| BELGIUM | 126933 | 145148.05 | 7027270.52 | 254616.18 | 1.40 | -5,867 | -21.26 |
| NETHERLANDS | 94486 | 139080.39 | 9544818.48 | 247904.33 | 0.97 | 2,227 | 11.68 |
| COSTA RICA | 59127 | 120055.19 | 2852426.18 | 235890.72 | 0.80 | 2,507 | 15.79 |
| SPAIN | 129573 | 148509.46 | 7909066.84 | 231336.13 | 0.58 | 3,308 | 28.79 |
| CHILE | 77207 | 117570.29 | 9600835.07 | 219108.44 | 0.68 | 370 | 2.77 |
| TURKEY | 92699 | 140620.96 | 9165192.12 | 214449.5 | 0.62 | 240 | 1.96 |
| UNITED KINGDOM | 149589 | 118580.98 | 14388190.88 | 210267.38 | 0.58 | -326 | -2.85 |
| HONDURAS | 70368 | 98461.85 | 2718252.73 | 197107.06 | 0.38 | 1,444 | 19.30 |
| MEXICO | 54354 | 105200.12 | 56322524.76 | 185194.93 | 0.43 | 245 | 2.88 |
| COLOMBIA | 46411 | 87569.42 | 15088132.5 | 144067.83 | 0.53 | -2,118 | -20.14 |
| ECUADOR | 52160 | 64644.93 | 7689199.14 | 126498.73 | |||
| PHILIPPINES | 47772 | 69662.74 | 1394992.94 | 120193.6 | |||
| PERU | 58505 | 67925.76 | 6276037.06 | 116611.13 | |||
| ISRAEL | 38296 | 64778.9 | 1535303.71 | 112182.79 | |||
| DOMINICAN REPUBLIC | 52995 | 54697.84 | 1414452.84 | 108276.26 | |||
| Top 30 Subtotal: |
10097127 | 12230735.93 | 361617467.1 | 21979485.08 | |||
| Total: | 11253526 | 13466457.49 | 690588474.4 | 24046709.95 |
“Finally, it’s a demographic fact that the population center of the country and those living east of it, can be serviced via DCs because they are closer to east coast ports,” says McCahill. “Due to the benefit of geography, trade growth seems to be gravitating to east coast ports as it is measured by growth.”
SC
MR

More Ports & Shipping
- World Trade Centers offers a helping hand to create resilient, interconnected supply chains
- Shining light on procurement’s dark purchases problem
- As Red Sea Crisis Drags On, Shippers Eye Alternatives
- Global Container Shipping Industry Sets Sights on Tech Investment, Capacity Concerns
- US Ports to Share $653M in Funding to Improve Throughput, Reduce Emissions
- The Astonishing Port of Laredo
- More Ports & Shipping
Latest Podcast
 Explore
Topics
Procurement & Sourcing News
- Inflation, economic worries among top supply chain concerns for SMBs
- April Services PMI declines following 15 months of growth, reports ISM
- Despite American political environment, global geopolitical risks may be easing
- April manufacturing output slides after growing in March
- World Trade Centers offers a helping hand to create resilient, interconnected supply chains
- Bridging the ESG gap in supply chain management: From ambition to action
- More Procurement & Sourcing
Latest Procurement & Sourcing Resources
About the Author
Patrick Burnson, Executive Editor

Patrick is a widely-published writer and editor specializing in international trade, global logistics, and supply chain management. He is based in San Francisco, where he provides a Pacific Rim perspective on industry trends and forecasts. He may be reached at his downtown office: [email protected].
Follow SCMR on social media.
@SupplyChainManagementReview on Facebook
@SCMR on Twitter
SCMR on Linkedin
Subscribe

Supply Chain Management Review delivers the best industry content.

Editors’ Picks