The U.S. economic situation has stumped many economists as inflation since the COVID-19 pandemic continues to defy simple explanations. In 2021, the Federal Reserve Board believed inflation was transitory and due primarily to supply chain glitches, yet starting in March 2022, the Fed would begin the most rapid pace of rate hikes in 40 years in attempts to bring inflation under control. To the surprise of most economists and many executives, the Fed’s strategy has worked, as inflation has moved back toward the Fed’s long-term target while the economy has avoided falling into a recession. Inflation levels have especially cooled in the goods sector, where inflation for producers of final-demand goods and consumers has averaged less than 2% year-over-year growth since June 2023.
Given interest rate increases primarily operate through demand reduction mechanisms, this implies explanations suggesting that resolving supply chain snarls is the primary reason for cooling inflation cannot be correct. Raising interest rates reduces demand, but it cannot resolve. As such, something else must be at work. In this article, we advance an alternative explanation for the successful cooling of inflation for goods that highlights the role of a hoarding mentality as a key driver of the inflation dynamics we observed for goods from 2021 through 2023. Our explanation is inherently more demand-centric, showing why raising interest rates has brought goods inflation under control.
Setting the stage: Market dynamics in 2021
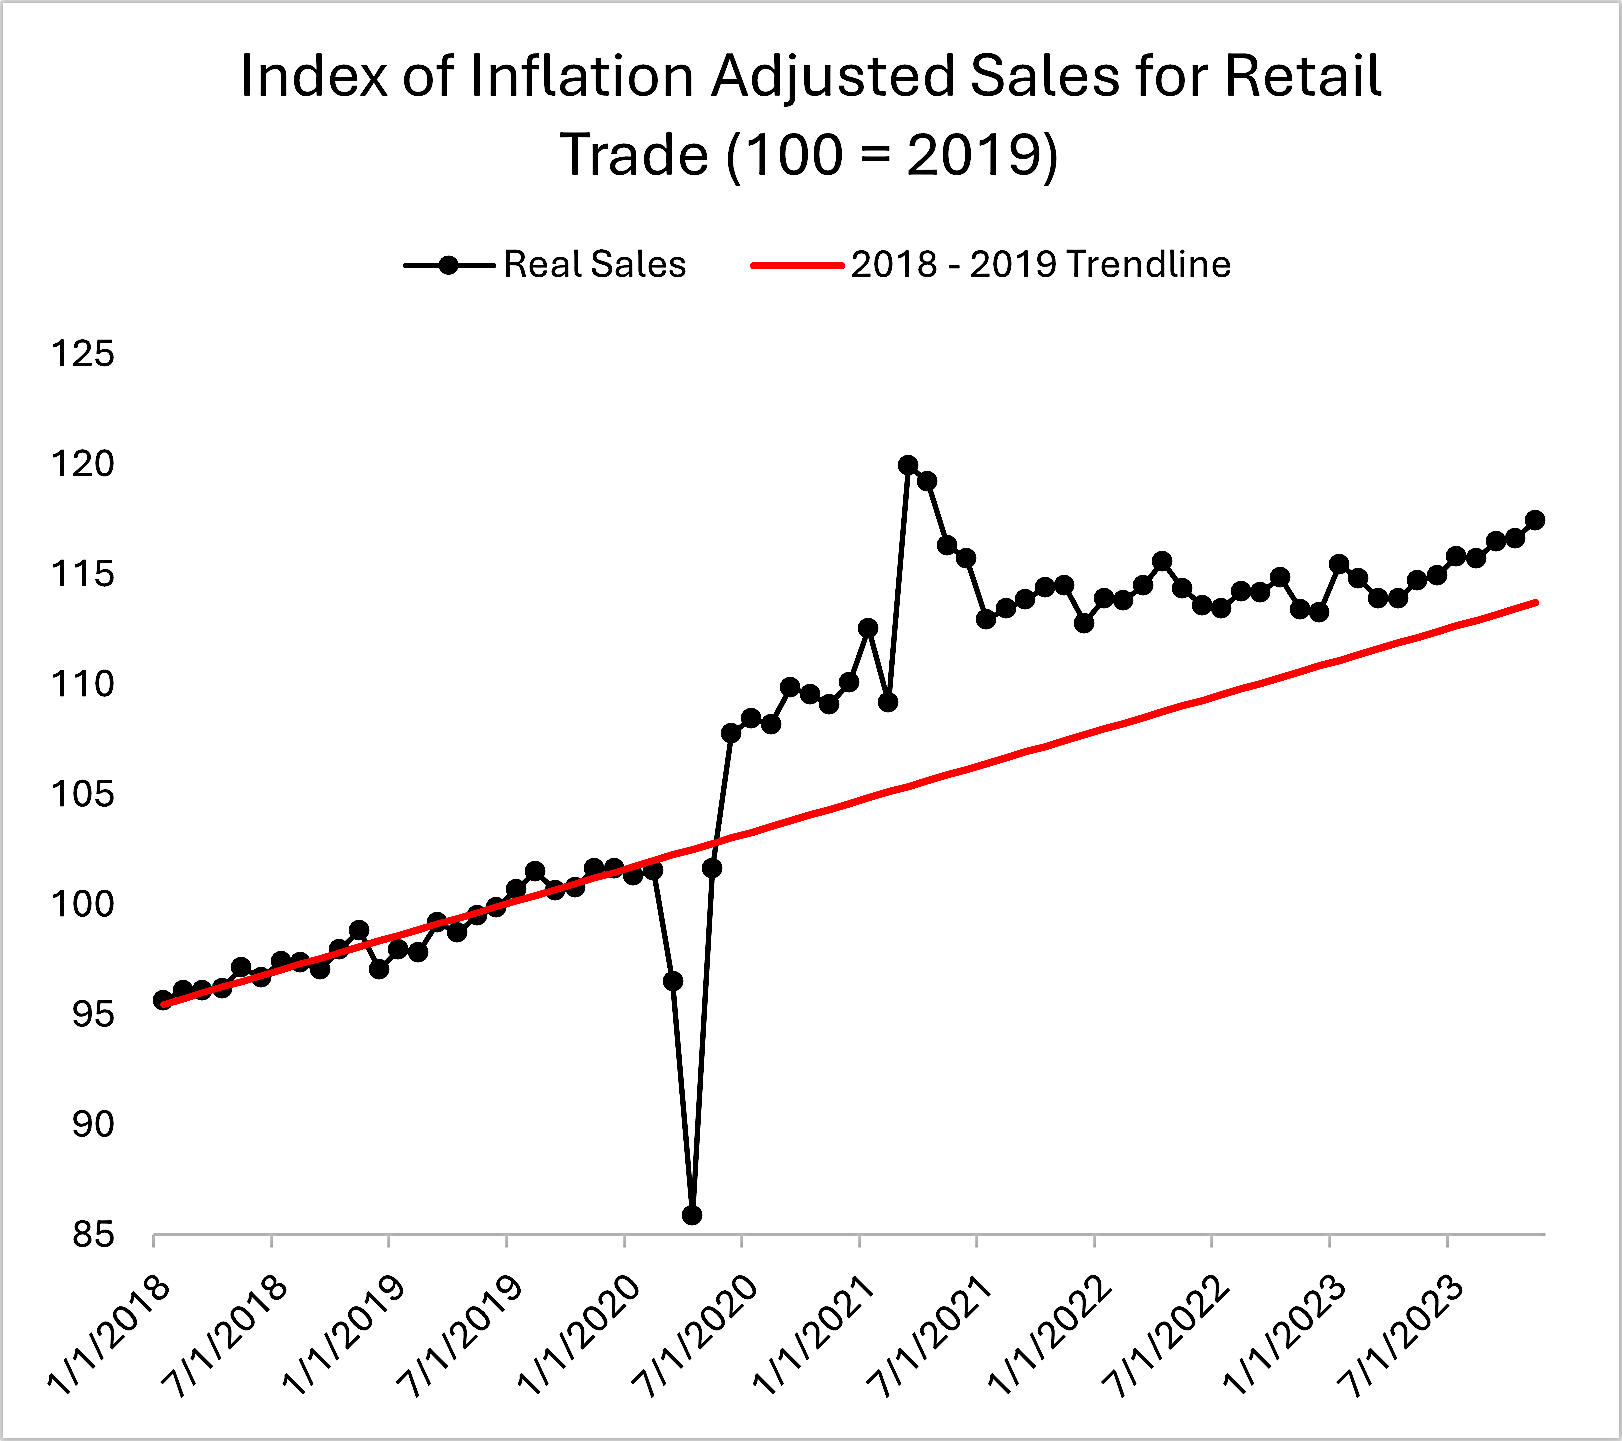
As inflation of consumer goods kicked into gear in Q2 2021, it is important to remember that during this time, stay-at-home orders meant more folks shopped online. In the absence of services, people bought goods. Simply put, demand was running hot with comments from the ISM PMI in June 2021 reporting very strong demand conditions across industries. One thing that drove this demand was seemingly insatiable consumer spending on goods of all types. Figure 1 illustrates inflation-adjusted for all retail trade, and shows that by June 2020, sales had spiked to 5% above the 2018-2019 trendline, with this deviation soaring to 15% above the trendline in March and April 2021. Surges in consumer spending can be directly traced to the spikes in disposable personal income due to government stimulus efforts (Footnote 1).
Concurrently, we also saw increased investment in residential structures (e.g., single-family housing starts, multifamily housing starts, and home improvements), with inflation-adjusted investment as of Q2 2021 rising 14% from pre-COVID levels. Additional demand came from the resurgence of hydraulic fracking as well as sharply rising prices of farm products (e.g., corn, soybeans) increasing farmers’ profits and generating their investment in farm equipment. On top of this insatiable demand, 2021 saw transportation disruptions and increasing shortages of several raw materials:
• The February 2021 polar vortex severely affected chemical production, which resulted in shortages of plastics.
• Flooding in Canada affected lumber supplies.
• The auto sector’s raw material shortage woes have been extensively documented.
Figure 1: Index of Inflation Adjusted Retail Sales
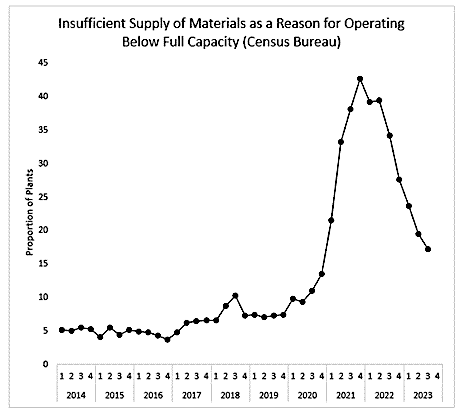
The effect of these shortages is illustrated in Figure 2 showing the percentage of manufacturing plants responding to the Census Bureau’s Quarterly Survey of Plant Capacity Utilization that they could not operate at full capacity due to insufficient supply of materials. Prior to the COVID-19 period, this number never exceeded 10%, yet ballooned to over 40% by the end of 2021.
Figure 2: Insufficient Material Supply as Reason for Below Capacity Plant Operations
Consider now what happens when this seemingly insatiable consumer demand combines with increasing shortages of materials. Conditions of insatiable demand and chronic material shortages are rare for capitalist economies like the U.S. (Footnote 2) outside of wartime. In a capitalistic economy, the lifetime costs of lost sales due to not fulfilling demand are typically far higher than increases in material costs. Buyers—confident in a market for their goods due to strong demand—are thus willing to pay higher prices for inputs since they can pass these costs on to their customers. Moreover, concerns about supply uncertainty give buyers an incentive to stockpile products (in economists’ terminology, “hoard”).
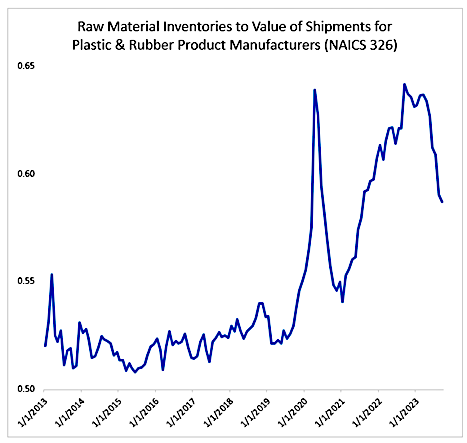
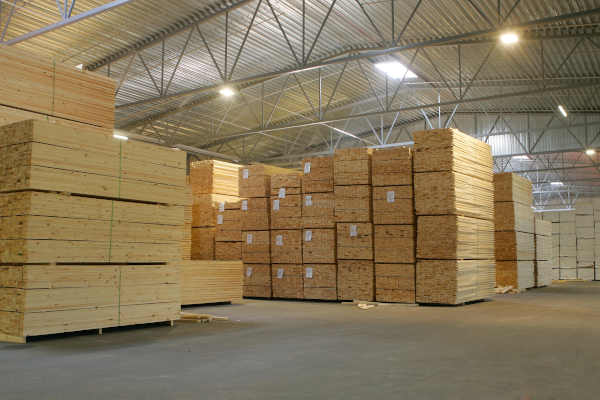
Take lumber for example; due to surging demand in 2021, users hoarded lumber to ensure supply, and in the process drove prices to stratospheric levels. We see further evidence of this hoarding behavior in plastic and rubber products manufacturing—a sector severely impacted by the disruptions of chemical production in early 2021—with the ratio of raw materials inventories relative to sales ballooning in 2021 through much of 2022 (Figure 3).
Figure 3: Ratio of Raw Material Inventories to Value of Shipments – Plastics & Rubber Product Manufacturers (NAICS 326)
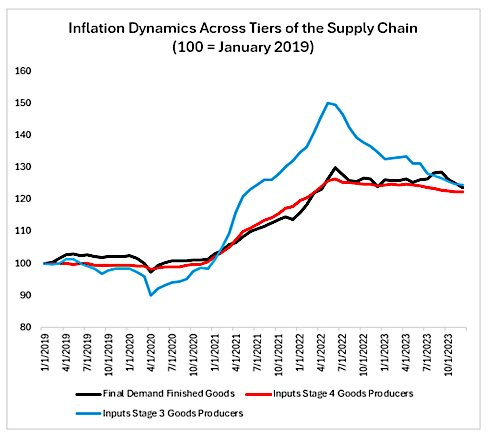
Combining strong customer demand with buyer hoarding, sellers know they are in a position of power and can command higher prices. Moreover, they have an incentive to do so because they know their costs are also likely to increase soon. This combination results in a price spiral, which can be seen in Figure 4 where we see price increases for inputs used by Stage 3 goods producers (think the plastic materials bought by firms that make plastic food packaging) rose before the prices of inputs used by Stage 4 goods producers (think the cardboard boxes, plastic packaging materials, and semi-processed foods purchased by breakfast cereal manufacturers), with the last prices to increase being those for final demand finished goods (the output prices of stage 4 goods producers such as breakfast cereal).
Figure 4: Inflation Dynamics across Multiple Supply Chain Tiers (Stages)
How the Federal Reserve’s interest rate hikes stemmed the inflationary cycle
In the explanation we’ve devised, there are two alternatives for breaking this inflationary cycle:
• Resolve shortages of materials. Doing this directly without affecting demand is very difficult because “shortages beget shortages” (Footnote 3). For example, a shortage of plastic resins leads to shortages of various plastic products, which then cascade to other downstream sectors.
• Reduce buyers’ perceived demand. This limits their need to purchase inputs.
This second alternative is precisely what the Fed’s interest rate hikes accomplished in 2022. For example, single-family housing starts were 20-30% above 2019 levels for 2021 through April 2022, but then fell back to 2019 levels by July 2022, and actually dipped below 2019 levels in Q4 2022. Reduced new housing starts meant less demand for goods, especially products like lumber that had experienced multiple price surges (in late 2020, early 2021 and again in early 2022) as builders hoarded lumber in anticipation of shortages for the peak building season. Similarly, higher interest rates have curbed demand for new warehouses, which reduces demand for products like construction steel and, ultimately, helps bring down the price of steel mill products.
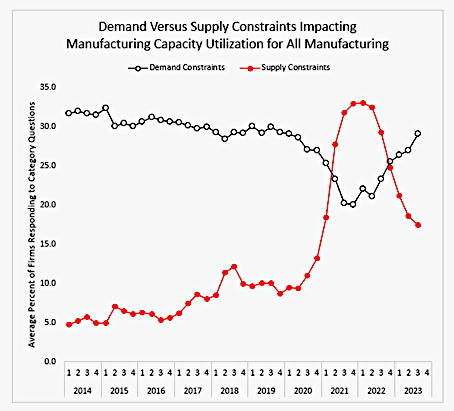
As demand declined through 2022, shortage issues were able to resolve themselves as manufacturers were better able to work through backlogs, which in turn resolved more shortages. Consistent with this explanation, Figure 5 shows the percentage of manufacturing firms citing demand-side constraints for below-target capacity utilization versus supply side constraints from the Quarterly Survey of Plant Capacity Utilization. Demand side constraints—insufficient orders, not profitable to operate at full capacity, or sufficient inventories of finished goods—increased steadily starting in Q2 2022 and have subsequently continued to rise toward pre-COVID levels, while supply side constraints—insufficient labor, insufficient supply of raw materials, or logistics/transportation constraints—have abated, albeit more slowly. The key implication is that this process would not have likely played out this way if not for the Fed intervention - reducing goods demand by raising interest rates.
Figure 5: Demand and Supply Side Constraints Influencing Capacity Utilization in Manufacturing
Footnotes:
(1) While it is true that some of the increased spending on goods was due to consumers not being able to spend on services, the role of stimulus payments cannot be overstated. For example, inflation adjusted spending on services also increased in March 2021.
(2) As economist János Kornai notes in his 1980 book Economics of Shortage. For readers concerned that different managerial incentives in socialist versus capitalist economies regarding profit may affect how managers approach dealing with shortages vis-à-vis profits, Kornai makes a strong case that the disruptions caused by shortages give managers an incentive to resolve these issues regardless of profit motive. Even socialist managers had to hit production quotas, which gives an incentive to resolve shortages.
(3) As Kornai noted in Economics of Shortage.
SC
MR

More Supply Chain Management
- U.S.-bound containerized import shipments are up in June and first half of 2024
- Expand supply chain metrics to cover the complete customer experience
- When disaster strikes, the supply chain becomes the key to life
- Leadership development for supply chain leaders
- A smarter approach to sustainability is vital for healthy, resilient supply chains
- When the scales tilt: Making vaccine access work for all
- More Supply Chain Management
Latest Podcast
 Explore
Topics
Procurement & Sourcing News
- AI-driven sourcing: Why the speed of change is going to only accelerate
- A Silk Road city
- U.S.-bound containerized import shipments are up in June and first half of 2024
- Boeing turned to Fairmarkit, AI to help land its tail spend
- When disaster strikes, the supply chain becomes the key to life
- A smarter approach to sustainability is vital for healthy, resilient supply chains
- More Procurement & Sourcing
Latest Procurement & Sourcing Resources
Subscribe
Supply Chain Management Review delivers the best industry content.

Editors’ Picks


