Editor’s Note: Norman Katz, president of supply chain consultancy Katzscan Inc., writes a monthly column for Supply Chain Management Review. Katz’s column appears on the third Monday of each month.
A buddy of mine, Mike in my fencing club, told me as we were chatting about nothing in particular one time that he was color-blind. Mike was in the construction industry, his specialty was laying tiles, and he did jobs on the side. His favorite jobs were doing kitchen back-splashes, and he also did floors and bathrooms. He couldn’t help his customers pick the tile colors due to his lack of ability to discern colors. But Mike discovered that he had the enhanced ability to distinguish subtle shades of gray, and that this capability helped him to cut and align tiles with more precision. The result was that Mike received rave reviews on the quality of his work from his customers and was often referred for other side jobs.
On a consulting assignment where I was putting together data visualizations on supply chain performance, I was reviewing the results with my reporting manager when he told me that one of the executives who would be the recipient was color-blind and that as nice as everything looked to the rest of us, this particular executive would not be able to appreciate any of it.
Well, that would not do, no, not one bit. I thought of my fencing friend and how I could alter the data visualizations to accommodate all recipients.
I briefly thought of using just a gray-scale, but quickly realized that the shades of gray could be too subtle for some people to differentiate. I didn’t want to make the exception the norm, but I did want to ensure that I accommodated all parties equally.
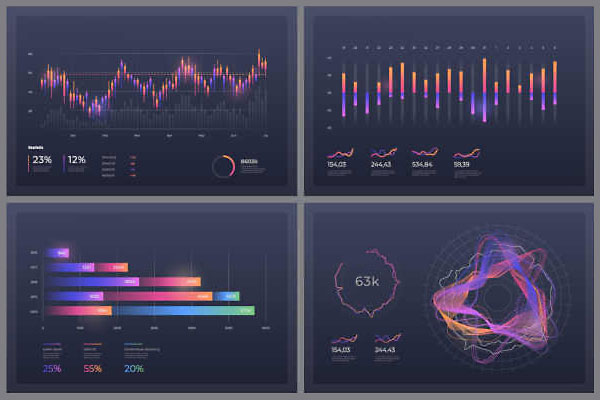
I first decided to distinguish how I was presenting the different types of data: quantities versus monies. I opted to use vertical bar charts for the quantities, and horizontal bar charts for the monies. This would allow the viewer to quickly identifier what they were about to look at regarding unit values.
Next, I decided that the use of colors was fine, but that I also needed to use fill patterns associated with each color. I ensured that there weren’t too many colors used, e.g., red (severe), orange (bad), yellow (warning), blue (good), green (great), and selected fill patterns easily distinguishable from each other. I made the use of colors and their associated fill patterns consistent across all metrics, regardless of type (quantity or monetary).
When I presented the supply chain metrics that I created from the raw data that I gathered, all recipients were wowed by the ability to quickly gravitate to and easily understand exactly what was going on. Whether the recipient could or could not see the colors, it did not matter. The messages that each visualization conveyed came through loud and clear, and that was what the objective was all about.
Good reporting standards should be part of an organization’s policies and guidelines. Expanding those reporting standards to consider people with unique requirements is achievable. Don’t wait until someone asks, and don’t force someone to be an exception: make sure that your data visualizations can be read by all those who receive them, whether the audience is internal or external.
SC
MR

More Columns
- C-suite sync: Turning strategy into enterprise execution
- Training in the real system: How immersive projects prepare the next generation of supply chain professionals
- Doing more with less: Practical AI moves for procurement teams in 2026
- Why 2026 demands a new freight playbook
- Fixing the misalignment between supply chain leaders and the C-suite
- Beyond the contract: Why your 3PL should be a strategic collaborator, not a commodity
- More Columns
Latest Podcast

 Explore
Topics
Business Management News
- What options do you really have? Shaping the supply chain resilience funnel
- Nexus suppliers: Hidden anchors of resilience in decentralized supply chains
- Finding the ROI in supply chain education
- Managing human and AI teams across the supply chain
- Risk sharing is the new advantage in capital project delivery
- The AI-empowered supply chain leader
- More Business Management
Latest Business Management Resources
About the Author
Norman Katz, President of Katzscan
Norman Katz is president of Katzscan Inc. a supply chain technology and operations consultancy that specializes in vendor compliance, ERP, EDI, and barcode applications. Norman is the author of “Detecting and Reducing Supply Chain Fraud” (Gower/Routledge, 2012), “Successful Supply Chain Vendor Compliance” (Gower/Routledge, 2016), and “Attack, Parry, Riposte: A Fencer’s Guide To Better Business Execution” (Austin Macauley, 2020). Norman is a U.S. national and international speaker and article writer, and a foil and saber fencer and fencing instructor.
Follow SCMR on social media.
@SupplyChainManagementReview on Facebook
@SCMR on Twitter
SCMR on Linkedin
Subscribe

Supply Chain Management Review delivers the best industry content.

Editors’ Picks