In part 1, the T&L industry felt the brunt of the recession in terms of valuations, although EBITDA was relatively stable for SCCs as well as Rail and Maritime companies, but declined substantially for Air and Trucking firms. Valuations turned around dramatically in 2009 and continued in 2010. The SCCs lead the way with a surge of 128% from their bottom. They are now at the top of their 5 year valuation multiples. The question is – will these multiples continue to improve and “break out” or will this be the top? Below we examine SCC valuations in more depth to answer the question – where will valuations go over the next one to two years?
Industry Performance
Let’s first look at the public data on SCCs in comparison to other T&L companies. The average size of the typical public SCC increased from $1.125 billion in 2006 to $1.5 billion at year end 2010, a 33% improvement or 6% per year. This compares very favorably with trucking whose average revenue declined 9% and airlines which showed no change. On the other hand, rail and maritime both saw average revenue per public company increase 75% and 85% respectively.
Looking at earnings and leverage, we see that, for SCCs:
EBITDA has been extremely steady over the entire period fluctuating between 6.6% and 7.4% of revenue (not bad, particularly when compared with the airlines or the trucking industry, where margins fluctuated more severely and many companies actually lost money)
- Debt, while a relatively small portion of the capitalization, almost doubled from 2.7% in 2006 to 5.1% in 2010. All other T&L industries have much higher debt to capitalization ratios, and with the exception of rail, have all increased the proportion of debt from 2006 through year end 2010
SCC EBITDA/Rev ratios are one of the lowest in the industry because they have limited capital invested, limited depreciation and amortization and almost no debt. The lower cost and greater proportion of debt has reduced capital costs and helped SCCs and other T&L companies to increase both total entity and equity valuations.
From the market’s perspective a lot of consolidation across most segments has occurred. Companies continue to value having better supply chains to control their growing operations and better serve their customers. Customers continue to emphasize logistics to improve operational performance and better enable them to control, monitor, and evaluate their transportation and warehousing activities. Both carriers and shippers are looking for their supply chain systems to be a source of competitive advantage, particularly internationally. As such, real demand will continue to rise and SCCs offering distinctive solutions will be well.

Supply Chain Company Valuations in More Depth
The exhibit above shows two additional supply chain company valuation metrics, the average PE (price to earnings) and TEV/EBITDA ratios for the publicly traded SCCs. SCCs typically traded at PE’s of 20 to 24 times from 2006 through the 4th quarter of 2007. They then plummeted to below 13.0 in the 4th quarter of 2008. More recently, they passed their prior peaks and have recently gone to over 24 in the 4th quarter of 2010. During this same period, supply chain TEV/EBITDA multiples ranged from 8.5 to 11 before declining during the recession to a low of 5.5 at the bottom. They then recovered and have risen to 10.9 times in the 4th quarter of 2010. Obviously, public SCCs have experienced some dramatic changes in value over the last 5 years, although the earnings and cash flows were essentially steadily increasing.
Supply Chain Deals (Transactions) During the Period
While no data exists on private valuations in total, using all private and public transactions provides evidence of what has occurred. We see from the next exhibit that, on average, SCCs closed 18.4 deals per quarter from 2006 to 2010. Of these, 14.2 were strategic deals and 4.3 were financial deals (3.3 to 1). However, deal volume dropped 23% on average from the 1st quarter of 2009 through year end 2010 (only 10.2 strategic and 3.9 financial deals were closed per quarter). In addition, the mix of deals changed with the financial firms having a larger proportion of the total deals.
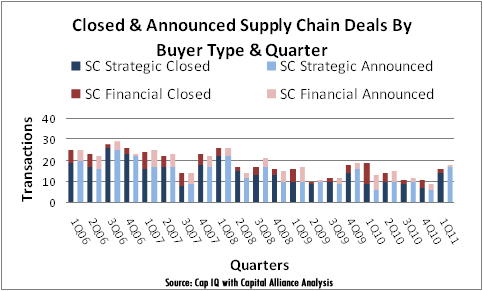
Beginning in the first quarter of 2011, deal volume was back and the mix had again changed. In total, 16 supply chain deals closed with a 7 to 1 ratio of strategic to financial buyers. In addition, there were more announcements then closings and activity is continuing. These recent changes suggest that SCC will likely pick up momentum and possibly higher multiples as the economy continues on its slow growth trajectory.
In the final article in this series, we will discuss what the future is likely to hold for both the economics and valuation of SCCs.
SC
MR

Latest Supply Chain News
- Joseph Esteves named CEO of SGS Maine Pointe
- Employees, employers hold divergent views on upskilling the workforce
- April manufacturing output slides after growing in March
- Q1 sees a solid finish with positive U.S.-bound import growth, notes S&P Global Market Intelligence
- World Trade Centers offers a helping hand to create resilient, interconnected supply chains
- More News
Latest Podcast
 Explore
Latest Supply Chain News
- Joseph Esteves named CEO of SGS Maine Pointe
- Employees, employers hold divergent views on upskilling the workforce
- April manufacturing output slides after growing in March
- Q1 sees a solid finish with positive U.S.-bound import growth, notes S&P Global Market Intelligence
- World Trade Centers offers a helping hand to create resilient, interconnected supply chains
- 6 Questions With … Sandeep Bhide
- More latest news
Latest Resources
About the Author
Michael S. Galardi, Senior Vice President

With over 35 years of experience in the transportation and logistics industry, Mike Galardi brings a wealth of experience to sellers. During his career, Mike has had senior roles as a strategy consultant, operating officer, and owner of a transportation company. Before joining Capital Alliance, Mike served as the Chairman and CFO of a regional expedited trucking company which he sold profitably in 2009. Prior to that, he was a Managing Partner in the Transportation and Logistics Strategy practice at Accenture, the lead Partner of the trucking practice at Oliver Wyman, and VP Sales and Marketing at Southern Pacific Railroad. Mike began his career on Wall Street at Kidder Peabody & Co., and then as a security analyst at Banker’s Trust. Mike has significant domestic and international experience having worked on five continents.
Mike holds a BS in Industrial Engineering, cum laude, from Lehigh University, and an MBA in Banking and Finance from Columbia University. He has also completed post graduate courses in accounting at the Stern School of Management at New York University. Mike has written or co-written three books on freight profitability, profitability analysis in transportation, and the outlook for the transportation industry, as well as appearing as a featured speaker at numerous industry gatherings, both in the U.S. and abroad.
Follow SCMR on social media.
@SupplyChainManagementReview on Facebook
@SCMR on Twitter
SCMR on Linkedin
Subscribe

Supply Chain Management Review delivers the best industry content.

Editors’ Picks