How much inventory is enough? How do you arbitrate across different viewpoints, weighing inventory investment against the impact of stocking out? Service Level has proven to be an objective metric that relates cost to risk, enabling the optimal allocation of scarce inventory dollars.
Service Level-Driven Planning (SLDP) enables organizations to find and agree upon their inventory balance point or “sweet spot,” where just the right amount of product or material is allocated to achieve required service levels over the replenishment lead time. Putting SLDP into practice is straight forward, subject to a few key requirements:
agreement upon a common definition of “service level,”
establishing service level targets for stocked items;
the ability to project the service level that will be achieved, given the committed level of inventory.
SLDP provides a real number that predicts the service level you are likely to achieve for every stocked item and for inventory overall. This makes it possible to look across all of the items and pinpoint which ones are over - and under-stocked. Knowing costs, service level goals, supplier lead times, minimum order quantities, and budget, SLDP practitioners can evaluate every inventory decision, calibrated by the stockout risk they are willing to take.
There are four basic steps to implementing SLDP:
1. Look through a common lens
Before starting the process, everyone needs to share a common definition of service level and how it relates to operations. At one distributor we visited, the operations team and sales team had wildly different estimates of the company’s service level because they defined service levels differently. A useful and generally accepted way to evaluate service level is the likelihood that an item will be in-stock when it is needed. So, a 95% service level means that there’s only a 5% likelihood of stocking-out. However, when someone refers to service level they might be referring to Fill Rate – the percentage of demand that was satisfied without regard to the probability of stock out. There’s also the question of item vs. order service levels. Item service levels focus on the ability to satisfy the number of units ordered while order service levels focus on the ability to satisfy individual customer orders. And finally, service level performance will vary significantly depending on the customer quoted lead time used. Service Levels reported will be higher shipping within two weeks vs. shipping on order. It’s important to distinguish precisely what is being measured and over what time frame.
2. Determine current service levels
If you don’t know where you are, you can’t know how to get where you want to be. So, it is critical to establish a benchmark to understand how well current inventory stocking policies are meeting expectations on an aggregate, as well as item level.
Often organizations don’t have a definitive answer because they measure the wrong things, such as:
• Considering the demand forecast, the supply position, and whether the forecast can be met without a deep understanding of forecast and supply variability. The missing element in the process often is a discussion of how much inventory is needed to support the required service level, or any discussion of what accounts for variability and uncertainty in the demand.
• Focusing on things that often mask poor service performance at lower levels by concentrating exclusively on aggregate fill rates. Diving a bit deeper into the data is the key to unlocking opportunities for service improvement and inventory reduction. For example, a 95% overall fill rate might sound great, but what did it take to get there? What percentage of the demand was filled from stock compared to expediting, trans-shipping, and other uneconomical and wasteful means? Were there certain items that never stocked out while others did routinely?
3. Identify overstocked and under-stocked items
Technology enables sophisticated analyses across thousands of items to set a benchmark for each, and determine which items run the risk of stocking out and which ones may be overstocked relative to service level goals. With proper technology, this can even be done even in the case of hard-to-forecast intermittent demand, as the example below demonstrates.
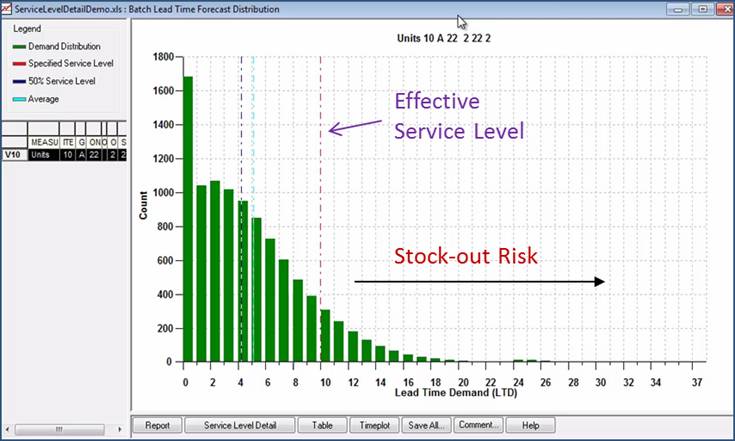
Figure 1. Projected Service Level and Intermittent Demand
Intermittent demand is seemingly random and characteristic of service parts or items that are demanded sporadically but are essential to the business. It is characterized by many periods of zero or very low demand interspersed with highly variable demand. This lack of a clear demand pattern makes the inventory planning challenge quite different and more difficult than planning for items with classic volume demand.
Figure 1 represents the demand distribution for an item with intermittent demand. Notice that it doesn’t look like a normal demand distribution.
The item in this example has a service level of 91% (91% of the time the item should be in stock). We can see that nearly 20% of the time demand for the item will be zero (represented by the tallest bar to the far left of the graph). The graph also shows us that, given the current inventory policy, the average demand (represented by the blue line) is 5 units, and that the reorder point for this item (the red line) is 10 units to cover the replenishment lead time.
Everything to the right of the red line represents demand that would not be covered given the 10 unit reorder point. This is the risk of stocking out. If the desired service level is 95%, this item is underperforming. If the item isn’t critical, and the desired service level is only 85%, it is overstocked. Either way, knowing this information can have significant financial and/or service implications.
Knowing information like this also allows you to move on to the next step.
4. Make rational inventory stocking decisions
With a benchmarked understanding of current inventory policies, technology also allows planners to play with service levels and lead times and do “what if” calculations to see the impact these changes will have on inventory investments.
Again referring to Figure 1, we expect that 10 units will be required over the lead time to achieve a service level goal of 91%. If this is a critical item, a 91% service level may not be a good enough. We can increase our goal to 99% and redo our SLDP simulation. This might yield a new reorder point of 18 units. Now we have a decision to make: is the higher service level, reducing your stockout risk to only 1%, worth nearly doubling the required inventory?
Armed with this information, the planning team can look at other factors such as whether the item is critical, how difficult it is to get replacements, and its cost. Taking all of this into account, and using simulations to model their effects in real-time, it’s possible to decide what service level is acceptable given the stock-out risk and associated cost.
A Nimble Response
With a common definition of service level and using rigorous statistical analysis to benchmark it, planners can test scenarios using what-if calculations. This ability can enable them to evaluate the consequences of inventory stocking decisions before they are implemented. The alternative, , is to make inventory policy changes for individual items in the production environment, and then wait to see the consequences over time. Ultimately, the service level-driven planning approach to inventory management provides a more nimble response to changes in demand and faster-time-to-results.
Gregory Hartunian is President of Smart Software, Inc. He can be reached by email at [email protected].
SC
MR

Latest Supply Chain News
- Technology’s role in mending supply chain fragility after recent disruptions
- Tech investments bring revenue increases, survey finds
- Survey reveals strategies for addressing supply chain, logistics labor shortages
- Israel, Ukraine aid package to increase pressure on aerospace and defense supply chains
- How CPG brands can deliver on supplier diversity promises
- More News
Latest Podcast
 Explore
Latest Supply Chain News
- Technology’s role in mending supply chain fragility after recent disruptions
- Tech investments bring revenue increases, survey finds
- Survey reveals strategies for addressing supply chain, logistics labor shortages
- Israel, Ukraine aid package to increase pressure on aerospace and defense supply chains
- How CPG brands can deliver on supplier diversity promises
- How S&OP provides the answer to in-demand products
- More latest news
Latest Resources
About the Author
Bob Trebilcock, MMH Executive Editor and SCMR contributor
Bob Trebilcock is the editorial director for Modern Materials Handling and an editorial advisor to Supply Chain Management Review. He has covered materials handling, technology, logistics, and supply chain topics for nearly 40 years. He is a graduate of Bowling Green State University. He lives in Chicago and can be reached at 603-852-8976.
Follow SCMR on social media.
@SupplyChainManagementReview on Facebook
@SCMR on Twitter
SCMR on Linkedin
Subscribe

Supply Chain Management Review delivers the best industry content.

Editors’ Picks