Sorry, but your login has failed. Please recheck your login information and resubmit. If your subscription has expired, renew here.
March-April 2010
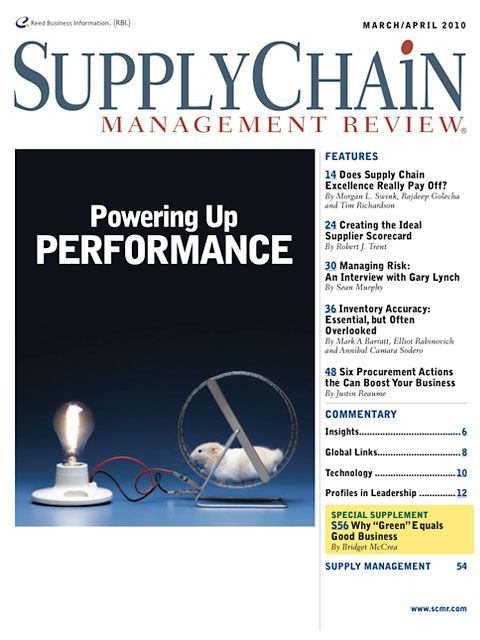
Business today is unrelenting. Just as you’ve finished up a dynamite promotion campaign or launched a superefficient distribution center, the market has a tendency of saying, “Not bad, but what have you done for me lately?” That’s cold! It’s exactly because of that competitive reality that companies today need to constantly fine tune and update every aspect of their performance. Naturally, we’re particularly concerned about that part of the business called supply chain management. Browse this issue archive.Need Help? Contact customer service 847-559-7581 More options
The short answer is a resounding yes! New research findings show that the top supply chain management companies significantly outperform their competitors across most financial measures. This article offers insights into those financial gains that differentiate the leaders from their rivals—and offers tips on how to get your top management interested in investing for supply chain excellence.
Do top supply chain companies consistently outperform their peers financially?
What performance metrics are most powerful in distinguishing top performing supply chain companies from their competitors?
How do you justify supply chain investments and get your CFO interested in supply chain initiatives? ¹—even when accounting for other factors such as size and financial leverage. The market also appears to reward supply chain excellence, as the leading supply chain companies show greater stock returns and economic value added. Over the 2004–2007 timeframe,¹ the supply chain leaders outperformed their closest competitors across the following metrics:
- 50 percent higher net margins.
- 20 percent lower operating and SG&A (Sales, General & Administration) expenses.
- 12 percent lower average inventories (days of sales).
- 30 percent less working capital expenses/sales.
- Twice the ROA (return on assets).
- Twice the ROE (return on equity).
- 44 percent higher economic value added.
- Twice the returns on stock prices.
- 2.4 times the risk-weighted stock returns.
- 46 percent greater market value-to-assets ratio.
These differences in performance are truly stunning. The following sections of this article discuss the approach we used to develop these findings and points out some surprising strategic implications for managers who seek to elevate their supply chain performance to the next level.
Identifying the Top SCM Companies
One of the initial challenges in this type of study is to identify “top” companies that are truly excellent in their supply chain management capabilities and practices. We combined multiple sources of data to identify these organizations, thereby minimizing the bias associated with any single source. The sources included the following:
• AMR Research Top 25/50 Supply Chain Rankings (2004-2008).
For several years AMR Research has identified the top 25 companies selected from the Fortune 500 based on a composite score of financial and perceptual metrics. The financial metrics (ROA, inventory turnover, and sales growth) account for 60 percent of the total score. The perceptual components (AMR Research Opinion and Peer Opinion Panel) are weighted at 20 percent each.
• Michigan State University MBA SCM Rankings (2007-2008).
Two MBA classes at the school's Eli Broad Graduate School of Management conducted research in 2007 and 2008 to identify top supply chain management companies in each of 20 different industry segments, including all manufacturing, distribution, and retail firms with sales greater than $100 million per year. The students first identified the six to eight companies that appeared in the top quartile of their respective segment most frequently over a two-year period on the following supply chain oriented metrics: ROA, gross margin, inventory turns, cash-to-cash cycle time, and sales growth. Using information from company sources, direct interviews, and published articles, the students scrutinized the supply chain performance of these candidate companies. They then identified and reported on the top two or three companies in each industry segment.
• CSC/SCMR/MSU Global Survey of Supply Chain Progress (2004-2008).
Each year Supply Chain Management Review
, CSC, and Michigan State have jointly conducted a survey on supply chain management practices and performance. One of the survey questions asks respondents to indicate who in their opinion represent the best supply chain companies. We included all companies that received at least three mentions by respondents in a given year.
• Supply Chain Digest (SCD)/Cannondale Associates Ranking (2008).
A recent study by Supply Chain Digest
and Cannondale Associates ranks the top supply chains in the consumer packaged goods and retail industries.
While each of these sources has potential biases, the combination of all sources offers a more complete variety of perspectives. The AMR Research study, for instance, is limited to large firms (Fortune 500) while the MSU study addresses both small and large firms. The AMR study is broad based while the MSU study is industry focused. The AMR and MSU studies are both U.S. centered while the CSC/SCMR study gathers perceptions from international respondents as well. By combining the findings of these different studies we reduced the potential that a myopic perspective would unduly influence the selection of top supply chain companies.
In compiling our final list, we selected companies that were identified by at least two of the studies at any time within the 2004-2008 timeframe.
Identifying Comparable Companies
²'s competitive report and Yahoo Finance Competitor Analysis. From the lists of direct competitors provided by Hoover's and Yahoo, we chose the company that was closest to each top supply chain company in terms of sales.² Table 1 at the end of the article lists each Top SCM company and the Comparable company selected.
As we mentioned earlier, part of the challenge with evaluating financial performance for the top companies is that most supply chain ranking systems either explicitly or implicitly use financial metrics as part of the rankings criteria. Importantly, our analysis determined that the financial criteria that influenced the selection of Top SCM companies do not actually have significant effects on overall performance differences between the top companies and comparable competitors. Our comparison indicated that only ROA and inventory turns are significantly higher on average for the Top SCM companies than for comparable companies. Cash-to-cash cycle and sales growth do not significantly differ between the two groups. And gross margin, in fact, is actually higher on average for the comparable companies.
Our conclusion: the use of these metrics in the original selection of the Top SCM companies does not appear to have systematically biased the results across the years. It's also important to note that our analysis explores differences on a wide range of operational, financial and stock market-based metrics that were not part of the initial ranking and selection procedures.
The Results: Clear Differences Emerge
Exhibit 1 gives the comparison statistics for operational, financial, and stock-based performance metrics. We used a paired t-test to compare the average scores for the Top SCM and Comparable companies in each year on each of the metrics. This analysis estimates the significance of a difference between the average scores for two groups, while taking into account the pairings of companies across the two groups. Except for sales growth, cash-to-cash cycle, and days receivables, the reported differences are statistically significant at a 95 percent confidence level or higher.
Let's take a closer look at the results for each of the categories of performance metrics—operational, financial and stock performance.
Operational Performance
While sales growth differences for top companies and their competitors are not statistically significant, the Top SCM companies appear to do a much better job of managing their working capital (see Exhibit 2). In particular, Comparable companies need almost one and a half times more working capital than the top performers to support a comparable level of sales.
As expected, the number of days of total inventory is lower for the top companies than for the others. These leaders have evidently created process and planning efficiencies that enable them to support the same levels of sales as their rivals with less overall inventory. Interestingly, there appears to be a difference in inventory and market strategies across the two groups. Top SCM companies hold a significantly larger proportion of their inventories in raw form (35 percent vs. 24 percent for Comparable companies). This inventory profile suggests that the top companies are likely more responsive by making greater use of postponement and make-to-order strategies. Also, raw materials inventories have a lower value, possibly accounting for the overall lower cost of inventories in Top SCM companies.
Differences in how the two categories of companies manage cash also point to some interesting strategic choices. The cash-to-cash cycle values are not statistically different between the two groups (recall that cash-to-cash cycle is calculated as days receivables + days inventories - days payables). Days receivables values are equal across the two groups. However, the average days payables for Top SCM companies is 55 days vs. 78 days for Comparable companies. This difference runs counter to what we would expect. Conventional wisdom would suggest that the better performing and larger leading companies would be able to negotiate more favorable payment terms with their suppliers. Why would the Top SCM companies pay their suppliers faster than Comparable companies do? Perhaps purchasing managers in the top companies are making a trade-off. They are more willing to give favorable payment terms to their suppliers in return for excellent performance and closer relationships. We will explore this possibility further as we analyze differences in the expenses of the two groups of companies.
Top SCM companies had lower operating expenses per sales dollar than their counterparts (see Exhibit 3). They also enjoyed lower SG&A expenses, lower R&D expenses, and lower advertising expenses per sales dollar. It is remarkable that the Top SCM companies achieved statistically similar levels of sales growth as the Comparable companies given their lower expenses in these areas. The results suggest that the top companies have developed superior efficiencies in all the related areas of the supply chain, enabling them to get the most out of their internal resources. This efficiency is also reflected in their deployment of human resources, as their revenue per employee is greater on average than for their competitors.
Surprisingly, the Top SCM companies had lower gross margins on average as compared to the Comparable companies, indicting either that their costs of good sold (COGS) are higher or their pricing power is lower. Given that the Top SCM companies are able to generate more sales per dollar spent on R&D, SG&A, and advertising, they appear to have substantial pricing power. Thus, the gross margin result suggests that Top SCM companies have higher COGS, yet they also have lower operating expenses. The implication is that they are paying higher prices to their suppliers.
A comparison of net margins sheds more light on the results. Though their gross margins are lower, Top SCM companies have significantly higher net margins than their competitors on average. Thus, while the top companies appear to be paying more for goods sold, their improved internal operating efficiencies and marketing power are great enough to more than offset the higher purchasing costs, making them more profitable at the bottom line.
This brings us back to the trade-off we mentioned earlier. The Top SCM companies appear to be paying suppliers more (higher COGS) and faster (lower days payable) in order to reap benefits elsewhere. These other these potential benefits likely include: The data are suggestive of each of these benefits, indicating that the top companies have opted to reward their suppliers in return for providing them with a lower total cost of ownership. The results also indicate that the Top SCM companies have a more variable cost structure. Their asset/employee ratios are almost 30 percent lower on average than the ratios for the Comparable companies. This result again suggests that the top companies are leveraging the capabilities of their suppliers, as they appear to have outsourced more of their asset-intensive processes. A look at goodwill gives a final insight into the strategy of Top SCM companies. Goodwill is generated when one firm acquires another firm. It is defined as the difference between the purchase price and the fair value of the acquired company's net assets. The goodwill for Comparable companies is on average more than twice that for the top firms. A likely explanation is that Comparable companies have had a greater propensity to grow through acquisitions, whereas the Top SCM companies have grown more organically. Growth through acquisition could also account for the apparent inefficiencies reflected in the higher operating expenses of the Comparable companies. It takes time to rationalize and fully integrate the different operating systems and products of acquired business units. Financial and Stock Performance The Top SCM companies also performed better on economic profit, one of the most comprehensive financial performance measures. Economic profit measures the true profits of a company by subtracting from the total revenue the total cost of doing business, including operating costs, taxes, depreciation and the total cost of capital invested. We evaluated two economic profit metrics: annual economic profit per dollar of invested capital, and annual economic profit per capital charge (where capital charge = WACC X Invested Capital). The economic profit generated by the Top SCM companies was about 50 percent greater than that generated by the Comparable companies in this timeframe. One would surmise that these kinds of financial results would make the Top SCM companies very attractive investments. The stock market data agree; they confirm that investments in Top SCM companies generated significantly higher average monthly stock returns when compared with rival options (see Exhibit 4). Investments in stocks of the Top SCM companies grew at more than twice the rate of Comparable companies. The Sharpe Ratio, which measures the stock returns weighted by risk, is two and half times higher for top companies. A final measure, Market Value/Assets, indicates that the market placed a 45 percent greater value on the assets of the Top SCM companies over the assets of the Comparable companies. These results indicate that these top companies provide both higher and less variable returns. The results of our study provide some useful guidance on the questions we asked earlier: Do top supply chain companies consistently outperform their peers financially? What performance metrics are most powerful in distinguishing top-performing supply chain companies from the others? As we stated earlier, benchmarking the practices of the top performers could help to clarify the needed changes. Most important is to quantify the opportunity value of SCM excellence using terms and metrics that are important to your CFO and other financial analysts. These are the early steps needed to progress down the road that leads to greater profits from SCM superiority. Our analyses omitted 2008 data due to the extraordinary market conditions of that year. Do Top SCM Companies outperform their rivals in a down economy? It is difficult to answer this question using data from only a single year, as there is high variability in financial data from year to year. We plan to repeat these analyses once 2009 financials become available. The Top SCM Companies are significantly larger on average than the Comparable Companies (average sales were $45B and $23B respectively), so one could argue that the differences in performance are due to scale and leverage. We used two methods to evaluate this possibility. First, we repeated the statistical tests on all the performance metrics, dividing each metric by sales in order to account for scale effects. Second, we used a technique called regression analysis to statistically control for size. In both procedures, the overall performance differences remained clearly evident. We used these results to examine the values for each of the Comparable Companies to determine whether or not it should be classified in the Top SCM category. The model indicated that both Colgate-Palmolive and Lenovo should have been classified as Top SCM Companies. Interestingly, the recently published 2009 AMR top supply chain company list included Colgate-Palmolive for the first time. We take this as a partial validation of our results.
Between 2004 and 2007, the Top SCM companies outperformed their competitors on every financial and stock market based performance metric that we evaluated. The top companies delivered a statistically significant better ROS. However, the more dramatic performance differences are reflected in ROA and ROE, where they delivered double the returns of Comparable competitors.Key Questions Answered
The results answer this question with a resounding yes! The magnitudes of the financial performance differences indicate that the payoffs are indeed substantial and highly desirable. Taken as a set, the average values for the Top SCM companies could be used to establish benchmarks for supply chain performance—though we hasten to add that there is high variability across industries. For example, 61 days of inventory might be quite lean for one industry and quite “fat” for another. In setting goals for improvement, managers would be advised to pick the top performers among their direct competitors as benchmarks.
To get an even more precise answer to this question we used a statistical technique call Logit Regression to identify the variables that have the greatest “predictive power.” The performance metrics that were found to be the most significant in identifying companies as Top SCM companies were:
Notes:

This complete article is available to subscribers
only.
Click on Log In Now at the top of this article for full access.
Or,
Start your PLUS+ subscription for instant access.
SC
MR
Sorry, but your login has failed. Please recheck your login information and resubmit. If your subscription has expired, renew here.
March-April 2010
Business today is unrelenting. Just as you’ve finished up a dynamite promotion campaign or launched a superefficient distribution center, the market has a tendency of saying, “Not bad, but what have you done for… Browse this issue archive. Download a PDF file of the March-April 2010 issue.|
|
Download Article PDF |
The short answer is a resounding yes! New research findings show that the top supply chain management companies significantly outperform their competitors across most financial measures. This article offers insights into those financial gains that differentiate the leaders from their rivals—and offers tips on how to get your top management interested in investing for supply chain excellence.
Do top supply chain companies consistently outperform their peers financially?
What performance metrics are most powerful in distinguishing top performing supply chain companies from their competitors?
How do you justify supply chain investments and get your CFO interested in supply chain initiatives? ¹—even when accounting for other factors such as size and financial leverage. The market also appears to reward supply chain excellence, as the leading supply chain companies show greater stock returns and economic value added. Over the 2004–2007 timeframe,¹ the supply chain leaders outperformed their closest competitors across the following metrics:
- 50 percent higher net margins.
- 20 percent lower operating and SG&A (Sales, General & Administration) expenses.
- 12 percent lower average inventories (days of sales).
- 30 percent less working capital expenses/sales.
- Twice the ROA (return on assets).
- Twice the ROE (return on equity).
- 44 percent higher economic value added.
- Twice the returns on stock prices.
- 2.4 times the risk-weighted stock returns.
- 46 percent greater market value-to-assets ratio.
These differences in performance are truly stunning. The following sections of this article discuss the approach we used to develop these findings and points out some surprising strategic implications for managers who seek to elevate their supply chain performance to the next level.
Identifying the Top SCM Companies
One of the initial challenges in this type of study is to identify “top” companies that are truly excellent in their supply chain management capabilities and practices. We combined multiple sources of data to identify these organizations, thereby minimizing the bias associated with any single source. The sources included the following:
• AMR Research Top 25/50 Supply Chain Rankings (2004-2008).
For several years AMR Research has identified the top 25 companies selected from the Fortune 500 based on a composite score of financial and perceptual metrics. The financial metrics (ROA, inventory turnover, and sales growth) account for 60 percent of the total score. The perceptual components (AMR Research Opinion and Peer Opinion Panel) are weighted at 20 percent each.
• Michigan State University MBA SCM Rankings (2007-2008).
Two MBA classes at the school's Eli Broad Graduate School of Management conducted research in 2007 and 2008 to identify top supply chain management companies in each of 20 different industry segments, including all manufacturing, distribution, and retail firms with sales greater than $100 million per year. The students first identified the six to eight companies that appeared in the top quartile of their respective segment most frequently over a two-year period on the following supply chain oriented metrics: ROA, gross margin, inventory turns, cash-to-cash cycle time, and sales growth. Using information from company sources, direct interviews, and published articles, the students scrutinized the supply chain performance of these candidate companies. They then identified and reported on the top two or three companies in each industry segment.
• CSC/SCMR/MSU Global Survey of Supply Chain Progress (2004-2008).
Each year Supply Chain Management Review
, CSC, and Michigan State have jointly conducted a survey on supply chain management practices and performance. One of the survey questions asks respondents to indicate who in their opinion represent the best supply chain companies. We included all companies that received at least three mentions by respondents in a given year.
• Supply Chain Digest (SCD)/Cannondale Associates Ranking (2008).
A recent study by Supply Chain Digest
and Cannondale Associates ranks the top supply chains in the consumer packaged goods and retail industries.
While each of these sources has potential biases, the combination of all sources offers a more complete variety of perspectives. The AMR Research study, for instance, is limited to large firms (Fortune 500) while the MSU study addresses both small and large firms. The AMR study is broad based while the MSU study is industry focused. The AMR and MSU studies are both U.S. centered while the CSC/SCMR study gathers perceptions from international respondents as well. By combining the findings of these different studies we reduced the potential that a myopic perspective would unduly influence the selection of top supply chain companies.
In compiling our final list, we selected companies that were identified by at least two of the studies at any time within the 2004-2008 timeframe.
Identifying Comparable Companies
²'s competitive report and Yahoo Finance Competitor Analysis. From the lists of direct competitors provided by Hoover's and Yahoo, we chose the company that was closest to each top supply chain company in terms of sales.² Table 1 at the end of the article lists each Top SCM company and the Comparable company selected.
As we mentioned earlier, part of the challenge with evaluating financial performance for the top companies is that most supply chain ranking systems either explicitly or implicitly use financial metrics as part of the rankings criteria. Importantly, our analysis determined that the financial criteria that influenced the selection of Top SCM companies do not actually have significant effects on overall performance differences between the top companies and comparable competitors. Our comparison indicated that only ROA and inventory turns are significantly higher on average for the Top SCM companies than for comparable companies. Cash-to-cash cycle and sales growth do not significantly differ between the two groups. And gross margin, in fact, is actually higher on average for the comparable companies.
Our conclusion: the use of these metrics in the original selection of the Top SCM companies does not appear to have systematically biased the results across the years. It's also important to note that our analysis explores differences on a wide range of operational, financial and stock market-based metrics that were not part of the initial ranking and selection procedures.
The Results: Clear Differences Emerge
Exhibit 1 gives the comparison statistics for operational, financial, and stock-based performance metrics. We used a paired t-test to compare the average scores for the Top SCM and Comparable companies in each year on each of the metrics. This analysis estimates the significance of a difference between the average scores for two groups, while taking into account the pairings of companies across the two groups. Except for sales growth, cash-to-cash cycle, and days receivables, the reported differences are statistically significant at a 95 percent confidence level or higher.
Let's take a closer look at the results for each of the categories of performance metrics—operational, financial and stock performance.
Operational Performance
While sales growth differences for top companies and their competitors are not statistically significant, the Top SCM companies appear to do a much better job of managing their working capital (see Exhibit 2). In particular, Comparable companies need almost one and a half times more working capital than the top performers to support a comparable level of sales.
As expected, the number of days of total inventory is lower for the top companies than for the others. These leaders have evidently created process and planning efficiencies that enable them to support the same levels of sales as their rivals with less overall inventory. Interestingly, there appears to be a difference in inventory and market strategies across the two groups. Top SCM companies hold a significantly larger proportion of their inventories in raw form (35 percent vs. 24 percent for Comparable companies). This inventory profile suggests that the top companies are likely more responsive by making greater use of postponement and make-to-order strategies. Also, raw materials inventories have a lower value, possibly accounting for the overall lower cost of inventories in Top SCM companies.
Differences in how the two categories of companies manage cash also point to some interesting strategic choices. The cash-to-cash cycle values are not statistically different between the two groups (recall that cash-to-cash cycle is calculated as days receivables + days inventories - days payables). Days receivables values are equal across the two groups. However, the average days payables for Top SCM companies is 55 days vs. 78 days for Comparable companies. This difference runs counter to what we would expect. Conventional wisdom would suggest that the better performing and larger leading companies would be able to negotiate more favorable payment terms with their suppliers. Why would the Top SCM companies pay their suppliers faster than Comparable companies do? Perhaps purchasing managers in the top companies are making a trade-off. They are more willing to give favorable payment terms to their suppliers in return for excellent performance and closer relationships. We will explore this possibility further as we analyze differences in the expenses of the two groups of companies.
Top SCM companies had lower operating expenses per sales dollar than their counterparts (see Exhibit 3). They also enjoyed lower SG&A expenses, lower R&D expenses, and lower advertising expenses per sales dollar. It is remarkable that the Top SCM companies achieved statistically similar levels of sales growth as the Comparable companies given their lower expenses in these areas. The results suggest that the top companies have developed superior efficiencies in all the related areas of the supply chain, enabling them to get the most out of their internal resources. This efficiency is also reflected in their deployment of human resources, as their revenue per employee is greater on average than for their competitors.
Surprisingly, the Top SCM companies had lower gross margins on average as compared to the Comparable companies, indicting either that their costs of good sold (COGS) are higher or their pricing power is lower. Given that the Top SCM companies are able to generate more sales per dollar spent on R&D, SG&A, and advertising, they appear to have substantial pricing power. Thus, the gross margin result suggests that Top SCM companies have higher COGS, yet they also have lower operating expenses. The implication is that they are paying higher prices to their suppliers.
A comparison of net margins sheds more light on the results. Though their gross margins are lower, Top SCM companies have significantly higher net margins than their competitors on average. Thus, while the top companies appear to be paying more for goods sold, their improved internal operating efficiencies and marketing power are great enough to more than offset the higher purchasing costs, making them more profitable at the bottom line.
This brings us back to the trade-off we mentioned earlier. The Top SCM companies appear to be paying suppliers more (higher COGS) and faster (lower days payable) in order to reap benefits elsewhere. These other these potential benefits likely include: The data are suggestive of each of these benefits, indicating that the top companies have opted to reward their suppliers in return for providing them with a lower total cost of ownership. The results also indicate that the Top SCM companies have a more variable cost structure. Their asset/employee ratios are almost 30 percent lower on average than the ratios for the Comparable companies. This result again suggests that the top companies are leveraging the capabilities of their suppliers, as they appear to have outsourced more of their asset-intensive processes. A look at goodwill gives a final insight into the strategy of Top SCM companies. Goodwill is generated when one firm acquires another firm. It is defined as the difference between the purchase price and the fair value of the acquired company's net assets. The goodwill for Comparable companies is on average more than twice that for the top firms. A likely explanation is that Comparable companies have had a greater propensity to grow through acquisitions, whereas the Top SCM companies have grown more organically. Growth through acquisition could also account for the apparent inefficiencies reflected in the higher operating expenses of the Comparable companies. It takes time to rationalize and fully integrate the different operating systems and products of acquired business units. Financial and Stock Performance The Top SCM companies also performed better on economic profit, one of the most comprehensive financial performance measures. Economic profit measures the true profits of a company by subtracting from the total revenue the total cost of doing business, including operating costs, taxes, depreciation and the total cost of capital invested. We evaluated two economic profit metrics: annual economic profit per dollar of invested capital, and annual economic profit per capital charge (where capital charge = WACC X Invested Capital). The economic profit generated by the Top SCM companies was about 50 percent greater than that generated by the Comparable companies in this timeframe. One would surmise that these kinds of financial results would make the Top SCM companies very attractive investments. The stock market data agree; they confirm that investments in Top SCM companies generated significantly higher average monthly stock returns when compared with rival options (see Exhibit 4). Investments in stocks of the Top SCM companies grew at more than twice the rate of Comparable companies. The Sharpe Ratio, which measures the stock returns weighted by risk, is two and half times higher for top companies. A final measure, Market Value/Assets, indicates that the market placed a 45 percent greater value on the assets of the Top SCM companies over the assets of the Comparable companies. These results indicate that these top companies provide both higher and less variable returns. The results of our study provide some useful guidance on the questions we asked earlier: Do top supply chain companies consistently outperform their peers financially? What performance metrics are most powerful in distinguishing top-performing supply chain companies from the others? As we stated earlier, benchmarking the practices of the top performers could help to clarify the needed changes. Most important is to quantify the opportunity value of SCM excellence using terms and metrics that are important to your CFO and other financial analysts. These are the early steps needed to progress down the road that leads to greater profits from SCM superiority. Our analyses omitted 2008 data due to the extraordinary market conditions of that year. Do Top SCM Companies outperform their rivals in a down economy? It is difficult to answer this question using data from only a single year, as there is high variability in financial data from year to year. We plan to repeat these analyses once 2009 financials become available. The Top SCM Companies are significantly larger on average than the Comparable Companies (average sales were $45B and $23B respectively), so one could argue that the differences in performance are due to scale and leverage. We used two methods to evaluate this possibility. First, we repeated the statistical tests on all the performance metrics, dividing each metric by sales in order to account for scale effects. Second, we used a technique called regression analysis to statistically control for size. In both procedures, the overall performance differences remained clearly evident. We used these results to examine the values for each of the Comparable Companies to determine whether or not it should be classified in the Top SCM category. The model indicated that both Colgate-Palmolive and Lenovo should have been classified as Top SCM Companies. Interestingly, the recently published 2009 AMR top supply chain company list included Colgate-Palmolive for the first time. We take this as a partial validation of our results.
Between 2004 and 2007, the Top SCM companies outperformed their competitors on every financial and stock market based performance metric that we evaluated. The top companies delivered a statistically significant better ROS. However, the more dramatic performance differences are reflected in ROA and ROE, where they delivered double the returns of Comparable competitors.Key Questions Answered
The results answer this question with a resounding yes! The magnitudes of the financial performance differences indicate that the payoffs are indeed substantial and highly desirable. Taken as a set, the average values for the Top SCM companies could be used to establish benchmarks for supply chain performance—though we hasten to add that there is high variability across industries. For example, 61 days of inventory might be quite lean for one industry and quite “fat” for another. In setting goals for improvement, managers would be advised to pick the top performers among their direct competitors as benchmarks.
To get an even more precise answer to this question we used a statistical technique call Logit Regression to identify the variables that have the greatest “predictive power.” The performance metrics that were found to be the most significant in identifying companies as Top SCM companies were:
Notes:
SUBSCRIBERS: Click here to download PDF of the full
article.
SC
MR

Latest Supply Chain News
- Technology’s role in mending supply chain fragility after recent disruptions
- Tech investments bring revenue increases, survey finds
- Survey reveals strategies for addressing supply chain, logistics labor shortages
- Israel, Ukraine aid package to increase pressure on aerospace and defense supply chains
- How CPG brands can deliver on supplier diversity promises
- More News
Latest Resources
 Explore
Latest Supply Chain News
- Technology’s role in mending supply chain fragility after recent disruptions
- Tech investments bring revenue increases, survey finds
- Survey reveals strategies for addressing supply chain, logistics labor shortages
- Israel, Ukraine aid package to increase pressure on aerospace and defense supply chains
- How CPG brands can deliver on supplier diversity promises
- How S&OP provides the answer to in-demand products
- More latest news
Latest Resources
About the Author
SCMR Staff

Follow SCMR for the latest supply chain news, podcasts and resources.
Follow SCMR on social media.
@SupplyChainManagementReview on Facebook
@SCMR on Twitter
SCMR on Linkedin
Subscribe

Supply Chain Management Review delivers the best industry content.

Editors’ Picks